TITLE: An email about hemispherical photography
DATE: 2018-09-02
AUTHOR: John L. Godlee
====================================================================
This is a transcript of an email conversation with a colleague that
I had about hemispherical photography and the various merits of
different methods. I thought the content was useful and wanted to
record it so I’ve put it up here. I’ve cleaned up the email a tiny
bit, just to make things clearer.
Colleague’s email
Dear John,
My supervisor suggested that I get in contact regarding your
knowledge of a new hemispherical camera that she thinks you’re
using in your research. I’m not sure if it’s the tool for the job,
but I’m trying to map the canopy cover of a very small area of
woodland in the Scottish Borders.
One part of my PhD research is looking at the influence of this
strip of mixed woodland on downslope soil moisture and groundwater
dynamics, so I’m mainly gathering sub-surface data on a transect
across the woodland. However, I also need to estimate canopy cover
in summer/winter as well as the extent of shading on the land
either side of the woodland.
I’m a geologist, not and ecologist, and I’m sure there are
standard methods for doing this, so if you have any thoughts
either using the hemispherical camera or other methods, I’d be
interested in any quick thoughts that you have.
Best wishes,
My reply
Hi,
Yep I got some money from the School last semester to buy some
hemispherical photography gear for the equipment store, which is
free to use. The available equipment consists of:
- 1x Nikon D750 Digital SLR Camera (24.3 MP) 3.2 inch
Tilt-Screen LCD with Wi-Fi
- 1x SIGMA 8mm f/3.5 EX DG Circular Fisheye Lens (Nikon fit)
- 1x Nikon 24-120mm f4 G AF-S ED VR Lens
- 1x KamKorda Professional Camera Bag
- 1x Neewer Hot Shoe Three Axis Bubble Spirit Level
- 1x SanDisk UHS-II 3.0, SD Card Reader (In the post)
- 2x Sandisk Ultra microSDHC 16GB - 80MB/s Class 10 UHS-I
- 1x PeliCase 1520 Case With Foam - Orange
I’ve used this camera to estimate canopy cover of savannas in
southern Africa and I can only imagine that it would work fine for
your patch of woodland as well.
When you say “map” do you mean get a spatially explicit estimate
of the canopy cover throughout the site? I’ve only ever used
hemispherical photography to get a single plot level estimate of
the canopy cover. Basically the mean and variance of the
percentage canopy cover as estimated from many photographs taken
at points on a regular grid laid out in the woodland area. Each
photo is essentially a point estimate of the canopy cover. You
could probably do a map, but you would have to increase the
density of the grid quite a bit to truly capture the variation
over space. To give you a rough idea, on a 100x100 m (1 Ha) plot,
I normally take 100 photos to get a plot level estimate. Taking
the photos doesn’t take very long at all, but setting up the grid
can be a faff if the woodland is thick.
Processing the hemispherical images can be a pain but is fairly
automated once you have a workflow set up. In the past I’ve used
imageJ ([
https://imagej.net/Welcome]), and if you only want to
estimate percentage canopy cover then I see no problem with using
it. I have some imageJ macros to batch analyse images if you want.
If you want to estimate more advanced things like Leaf Area Index
(the unit leaf area per unit ground area) or available
Photosynthetically Active Radiation below the canopy, you will
need to use something more advanced. I’ve recently discovered a
set of R scripts collectively known as HemiPhot
([
https://github.com/naturalis/Hemiphot]) which can estimate these
parameters.
The main thing to remember when taking hemispherical photos of the
canopy is that you have to do them early in the morning or late in
the evening, before the sun is overhead and too bright but with
some ambient light, otherwise you will find that you get a sun
flare on the lens, which makes the image basically unusable for
analysis.
I’ve attached a few papers which you can read if you want to on
the subject of how hemispherical photography (and other methods)
is used in forest/woodland/plantation contexts to estimate tree
canopy structure. By no means should you read them all, but they
might be useful further down the line.
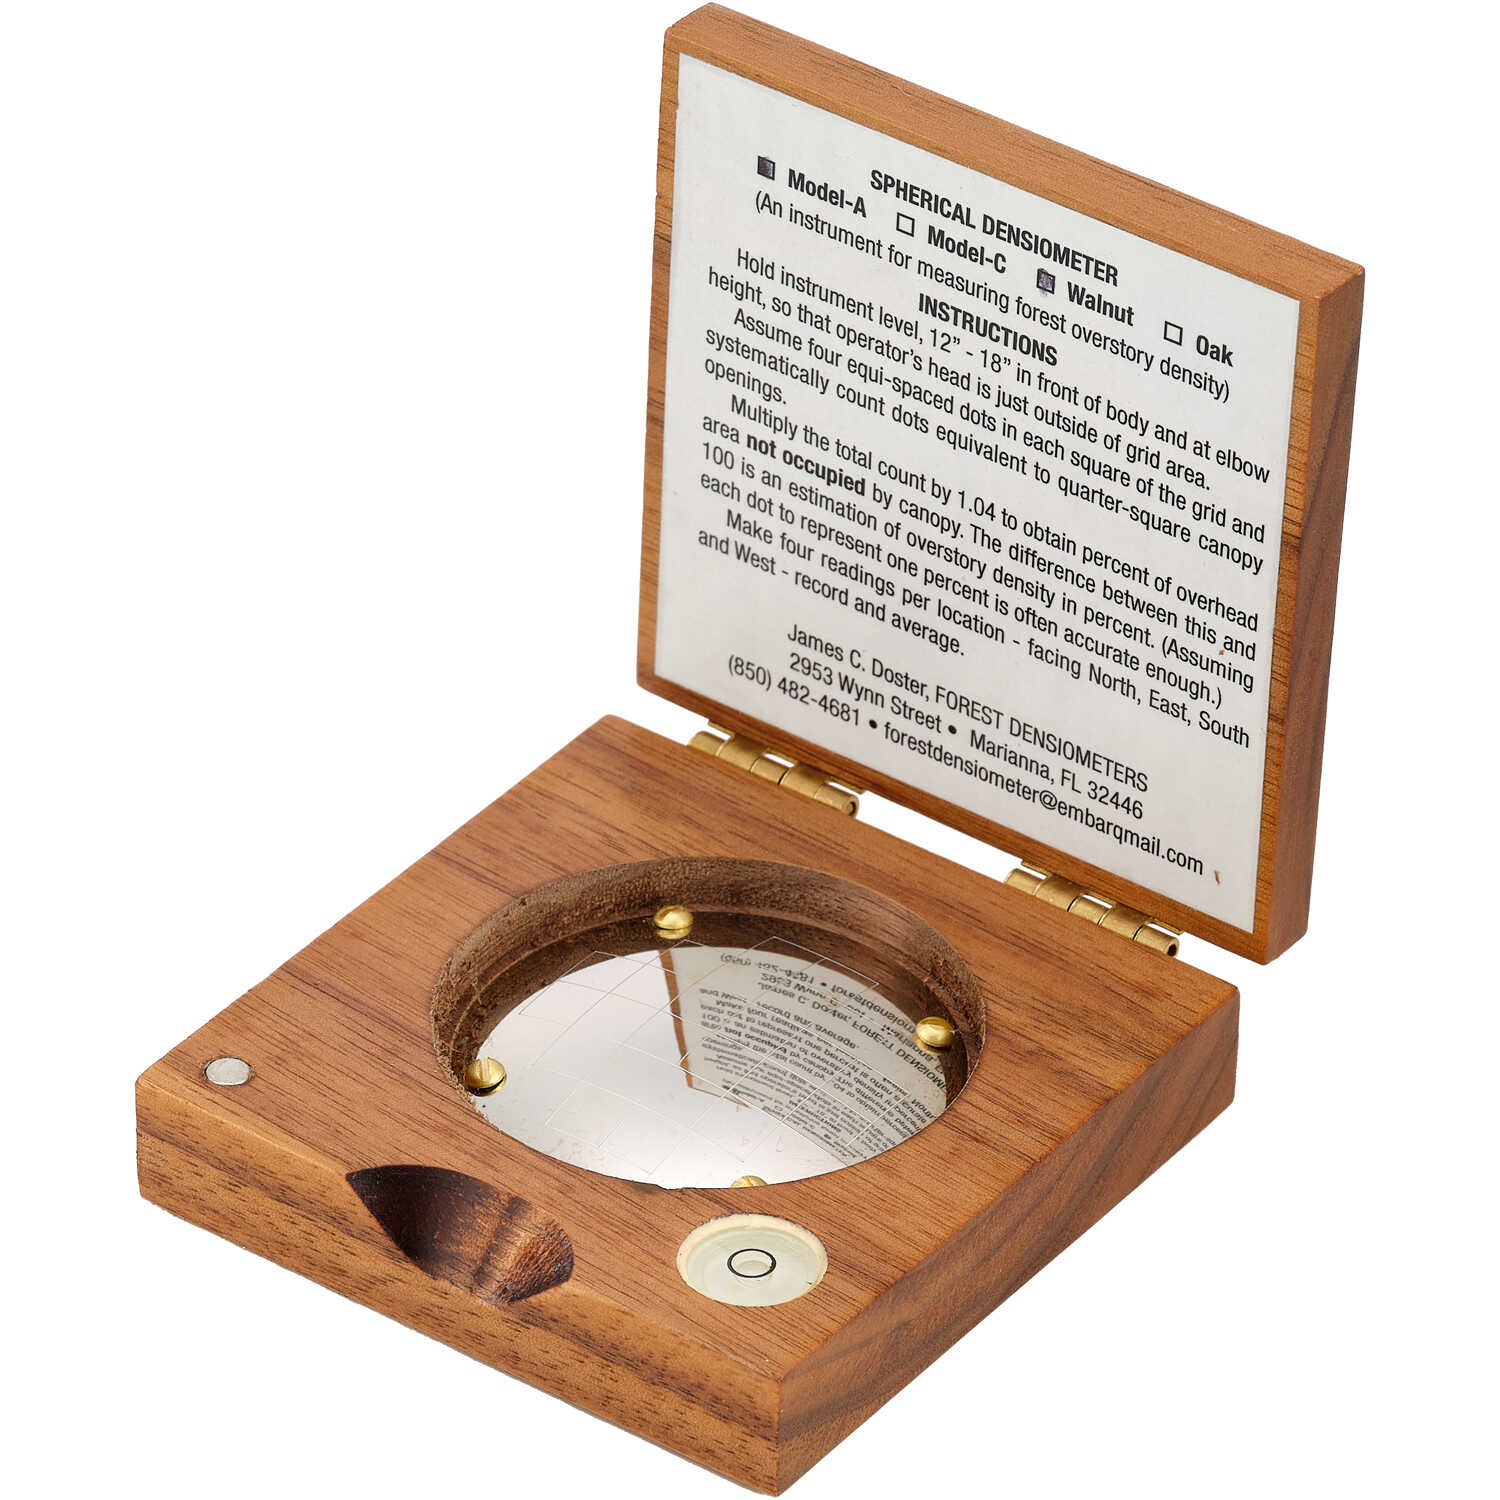
There are other methods for estimating canopy cover, but having
experimented with most of them, I think hemispherical photography
gives the most accurate result. Other options are to use a convex
mirror densiometer
([
http://www.forestry-suppliers.com/Images/Original/1397_43887_p1.jpg])
or to use a periscope densitometer
([
http://www.grsgis.com/densitometer.html]). The periscope
densitometer might be an option for making a high point density
map of your site, as the measurements are quite quick so you can
do more of them. The periscope densitometer method just requires
you to talk along the grid and at each point take a yes/no reading
of whether there is canopy touching the crosshairs of the
periscope mirror. You wouldn’t be able to make a map of percentage
canopy cover with the periscope densitometer, only a plot level
estimate as it uses the binomial nature of the measurement (yes or
no) to statistically estimate percentage cover, the value of each
point on its own isn’t useful. I wouldn’t EVER recommend the
convex mirror densiometer as they suffer from pretty serious
researcher bias.
Measuring the shade on the land either side of the woodland would
require a different method I think, though I’ve never done it
myself. I get the impression that in a closed canopy woodland at
this high a latitude, you could assume that when the path from the
Sun to the open ground adjacent to the woodland is blocked by the
woodland, all the direct sunlight is blocked. Considering this,
you could just measure the maximum tree height at increments along
the edge of the woodland using a clinometer or a laser range
finder, measure the orientation of the woodland edge, then use
that to model how long the shadow is at different times of the
year and how many hours during the day a given distance from the
woodland is shaded as the angle of the Sun changes. This has some
assumptions/caveats though, 1) the woodland is thick enough to
block all direct sunlight, and 2) the boundary of the woodland
edge is a straight line. If the woodland edge isn’t a straight
line it gets marginally more difficult as you would have to
include more measurements of the distance of the woodland edge
into your calculations of shade at different points.
These are the papers I attached:
- Jonckheere et al. (2004). Review of methods for in situ leaf
area index determination Part I. Theories, sensors and
hemispherical photography
- Breda (2003). Ground-based measurements of leaf area index: a
review of methods, instruments and current controversies
- Welles & Cohen (1996). Canopy structure measurement by gap
fraction analysis using commercial instrumentation
- Korhonen et al. (2006). Estimation of Forest Canopy Cover: a
Comparison of Field Measurement Techniques
- Pekin & Macfarlane (2009). Measurement of Crown Cover and Leaf
Area Index Using Digital Cover Photography and Its Application
to Remote Sensing
- Gardingen et al. (1999). Leaf area index estimates obtained for
clumped canopies using hemispherical photography
- Cook et al. (1995). Spherical Densiometers Produce Biased
Estimates of Forest Canopy Cover
- Fournier & Hall (eds.) (2017). Hemispherical Photography in
Forest Science: Theory, Methods, Applications