TITLE: Comparison of Mo et al. (2024) global wood density with
plots in the seasonally dry tropics
DATE: 2024-12-21
AUTHOR: John L. Godlee
====================================================================
This paper was recently published:
[This paper was recently published]:
https://doi.org/10.1038/s41559-024-02564-9
Mo, L., Crowther, T.W., Maynard, D.S. et al. The global
distribution and drivers of wood density and their impact on forest
carbon stocks. Nat Ecol Evol 8, 2195–2212 (2024).
In the paper, the authors use plot data from 1.1 million forest
plots, and wood density data from 10,703 tree species, to explore
global patterns in wood density. They find that water availability,
measured in their case by mean annual temperature and soil
moisture, is correlated with wood density, globally. They suggest
that the mechanism for this is that trees in "warm and dry regions
are likely to develop denser wood to maintain xylem resistance
against implosion and rupture".
Notably, this study included hardly any plot data from the
seasonally dry tropics, including tropical savannas and dry
forests. There is a particular lack of data from southern Africa:
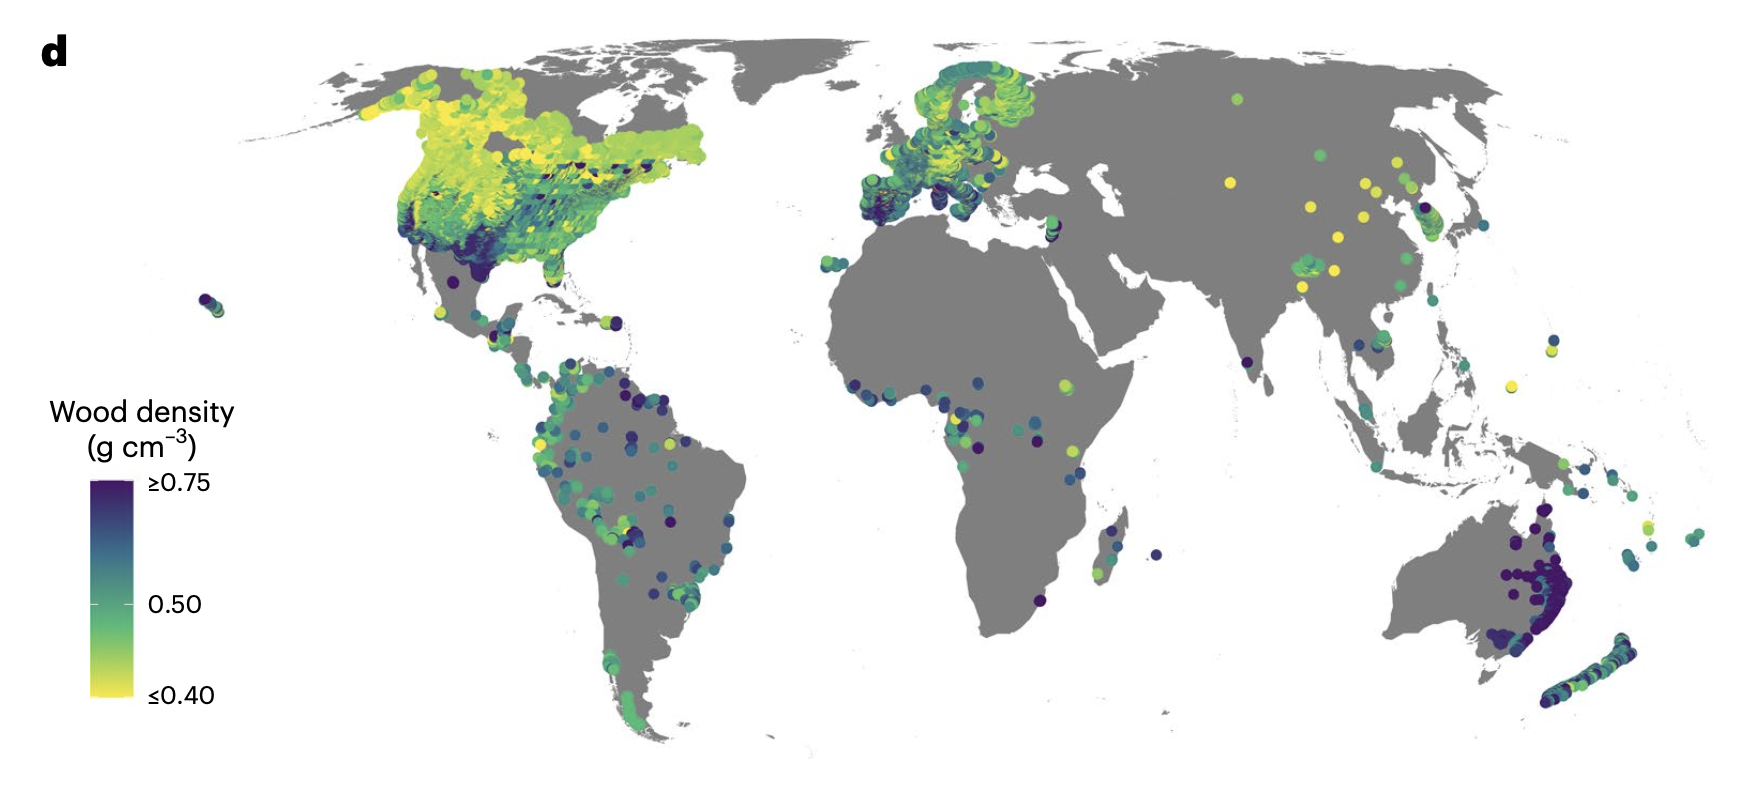
The authors use random-forest models to develop wall-to-wall maps
of predicted wood density across forested landscapes.
In my post-doc, we have amassed a dataset of ~1500 plots from
across the seasonally dry tropics, for which we have estimates of
wood density for each tree (>5 or >10 cm diameter). We used wood
density data from the Global Wood Density Database (Zanne et al.
2009) with extra data from Vieilledent et al. (2018). We used the
BIOMASS:getWoodDensity() function to estimate individual tree wood
density, which uses the species estimate where possible, then
genus, family, and finally plot-level if no data is available.
As in Mo et al. (2024), I took the Community Weighted Mean (CWM) of
wood density by basal area from each plot, using the most recent
census for each plot.
Below is a plot comparing our estimates of the CWM of wood density
from each of our plots, with the corresponding pixels from the
community wood density map in Mo et al. (2024) (see Figure 3a in
the paper). The line is a GAM smooth fit:
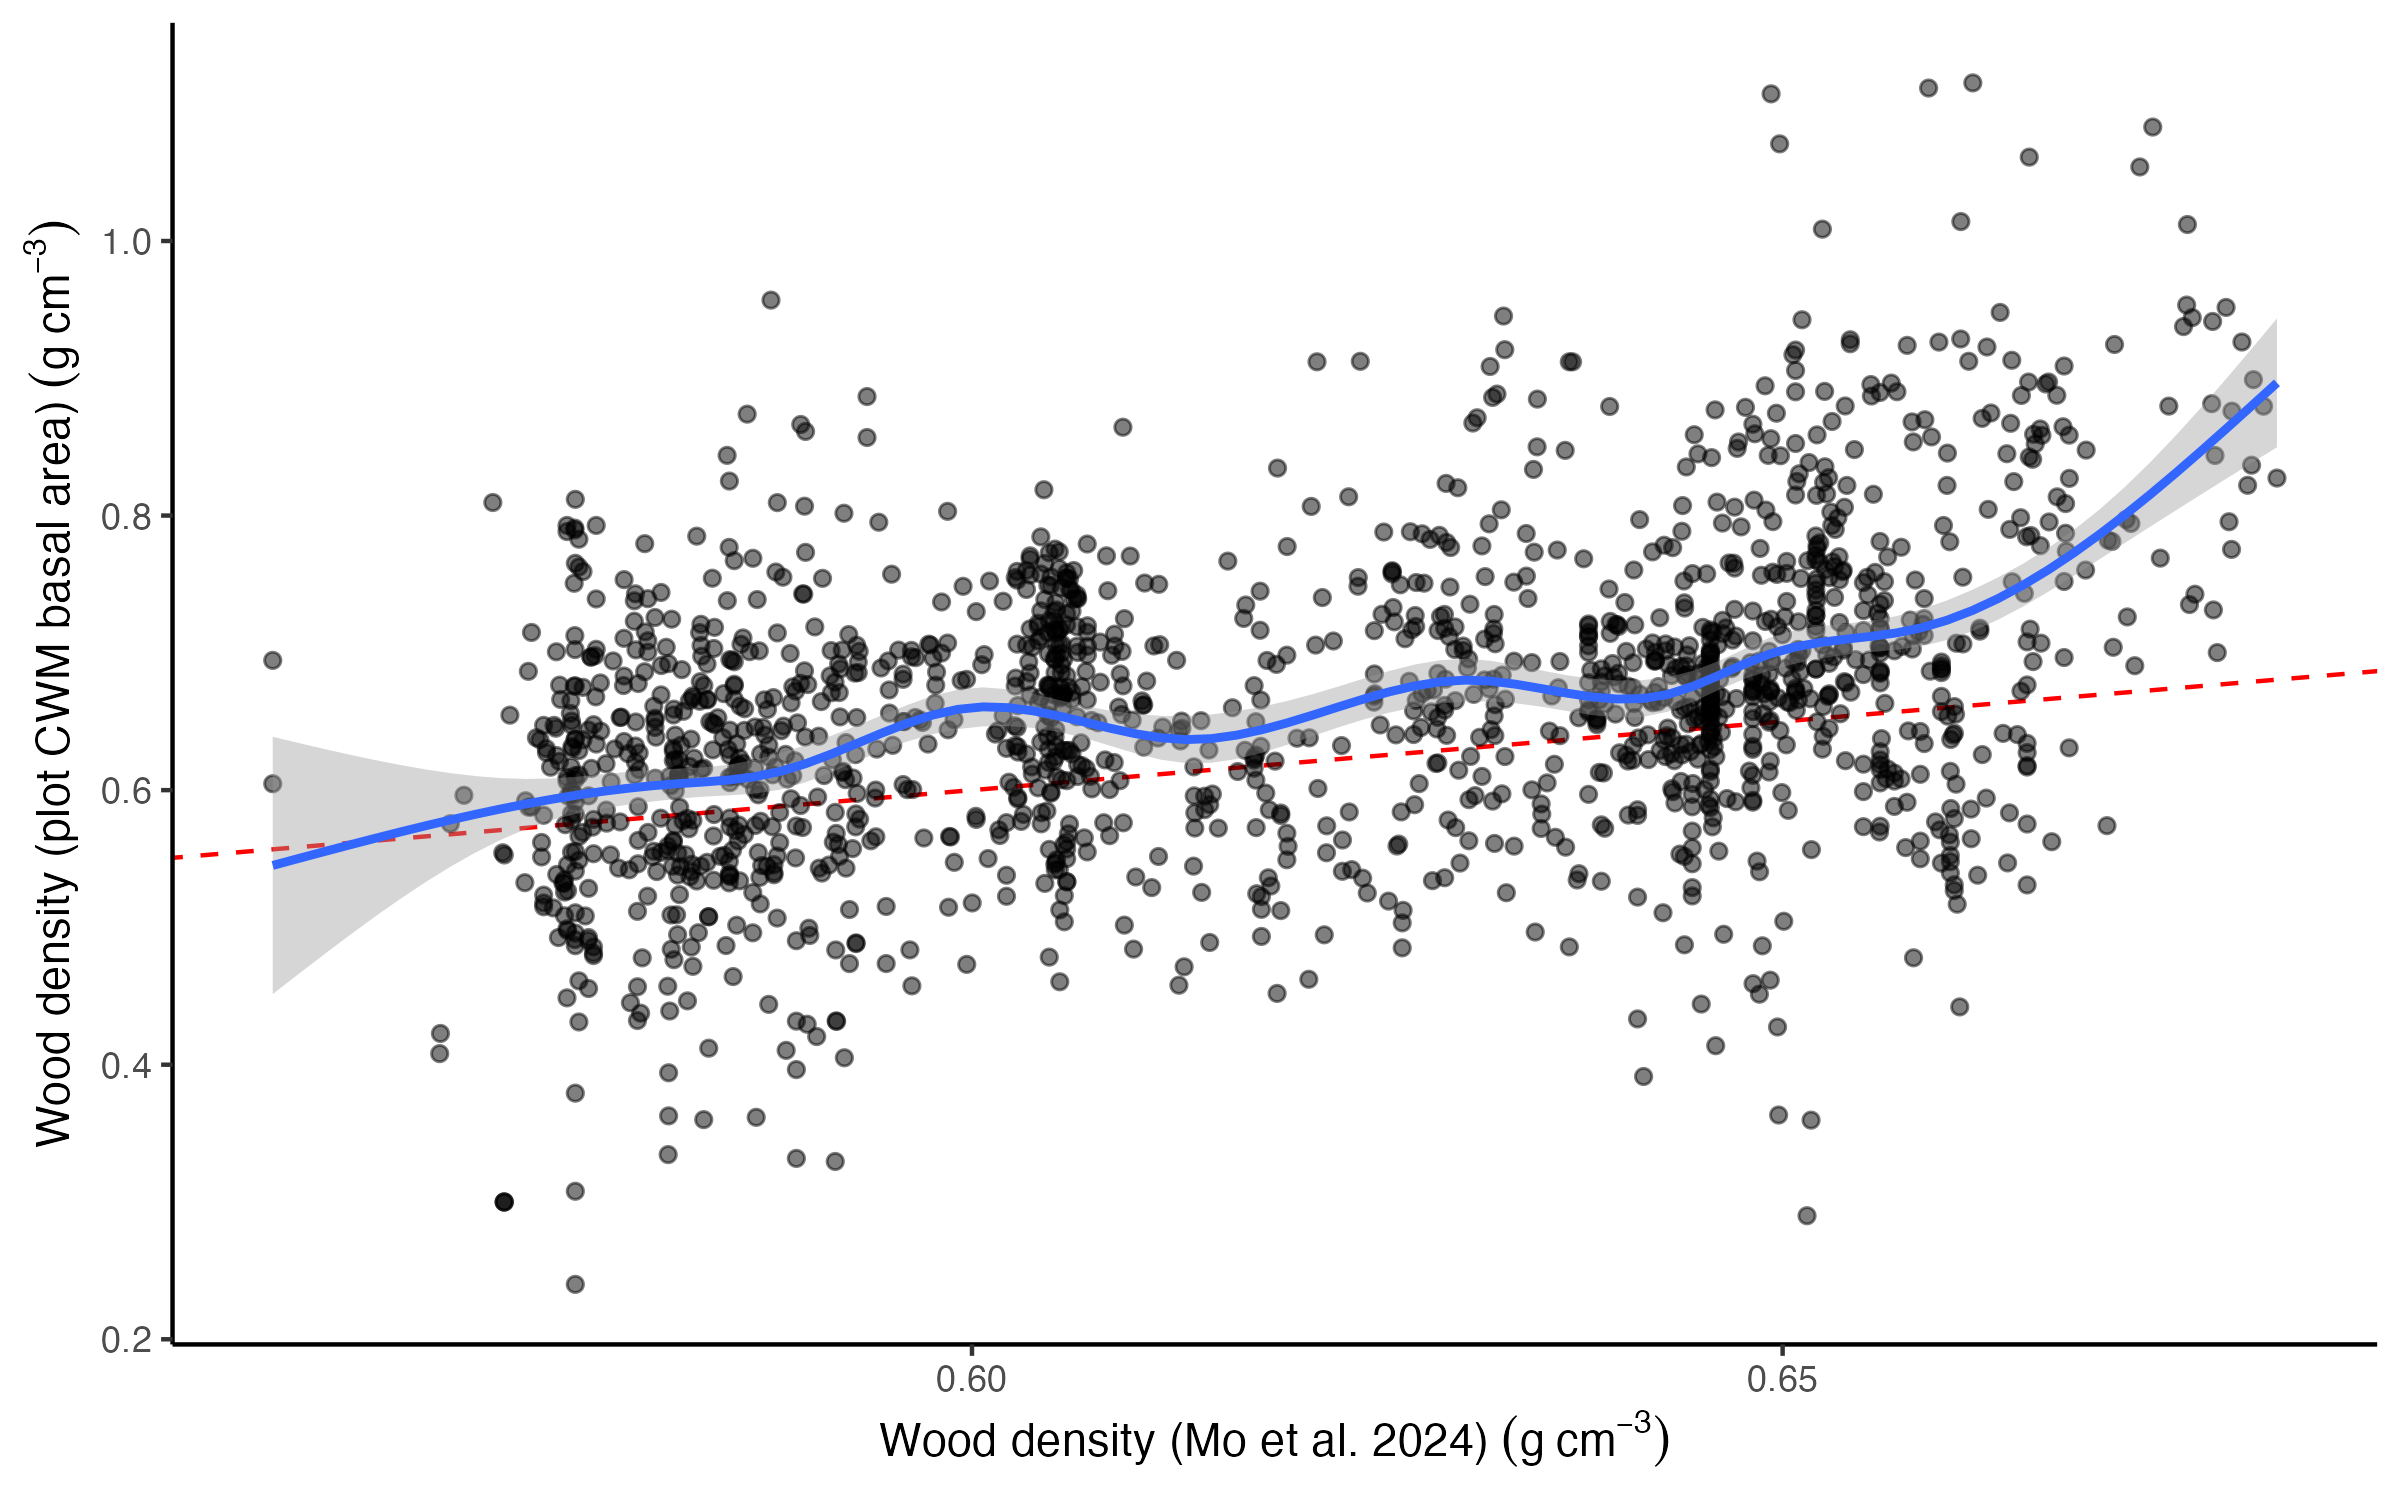
I think this shows good agreement between our plot-level estimates
and the spatialised estimates from the paper. We show greater
variation in wood density, but the average wood density of our
plots at any level of Mo et al.'s estimates is about the same.
We do not however, see strong relationships between plot-level wood
density estimates in the seasonally dry tropics with precipitation
or temperature (ERA5-Land 1980-2022). There is a weak negative
correlation between precipitation and wood density, as in the
paper, but we don't see any effect of temperature, which the paper
regards as the strongest environmental filter acting on wood
density.
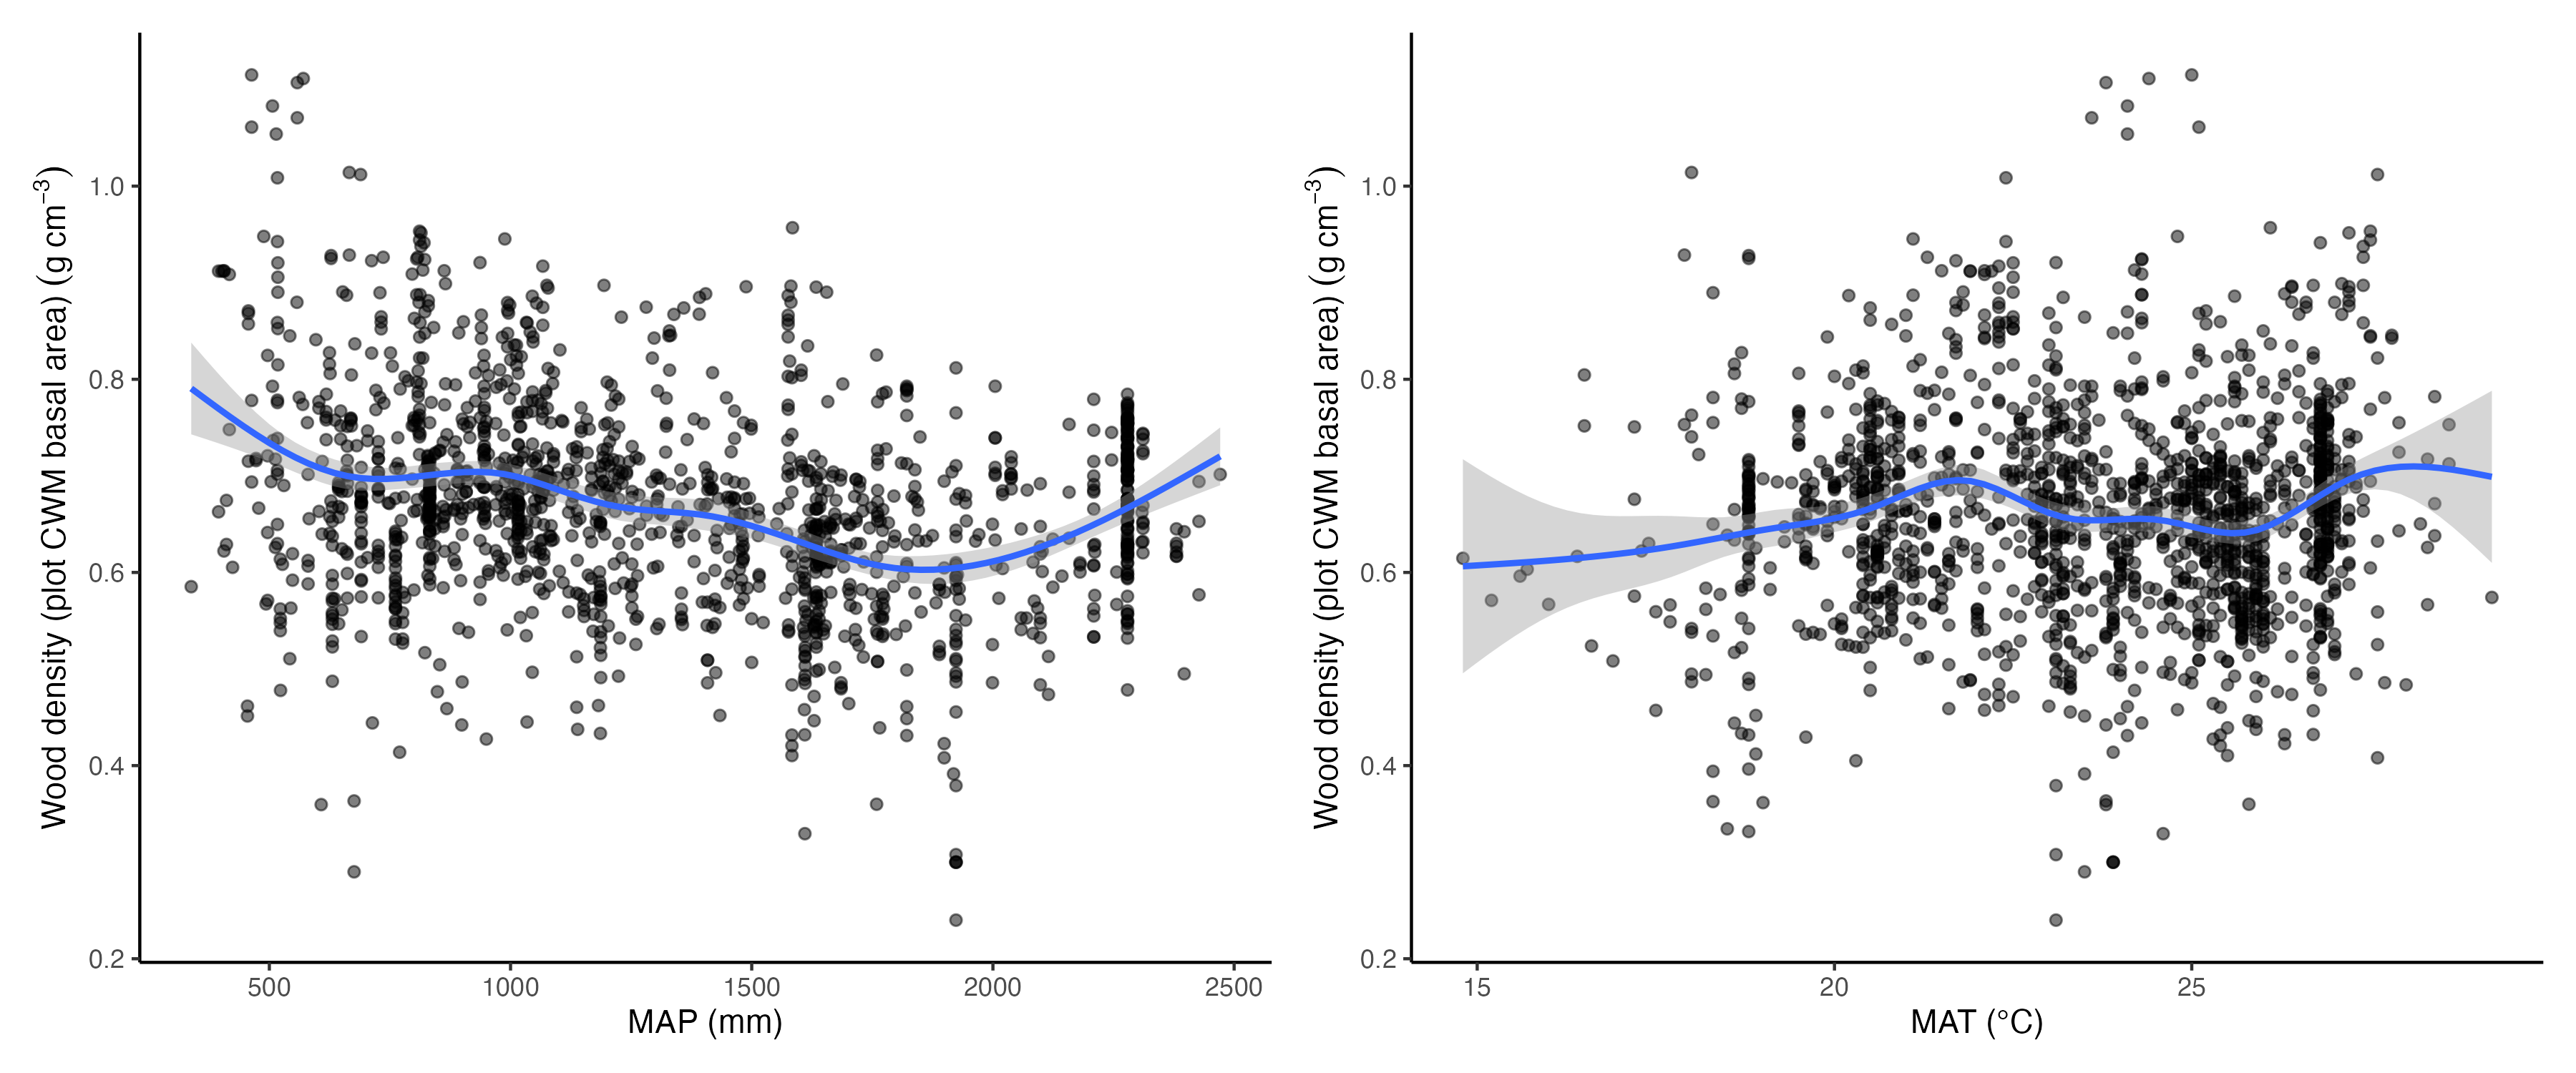
This might because our data, which span the environmental space of
woody ecosystems in the dry tropics, don't cover a wide enough
environmental gradient to detect an effect of temperature, while
the data in Mo et al. (2024) cover a wide range of biomes across a
broad latitudinal range.
From this basic comparison, it seems like the lack of data from the
seasonally dry tropics hasn't harmed the estimates in Mo et al.
(2024). I wonder though, if they did add more data from the
seasonally dry tropics, would they find a stronger effect of fire
disturbance, and a weaker effect of temperature on wood density?
The authors acknowledge that their dataset of global "forests"
might under-represent fire, and there is a clear bias towards
temperate and boreal regions in their plot data.
I see this wood density map being especially helpful in building
biomass maps from radar or LiDAR data, which can sense woody
volume, but not wood density. For plot-level analyses however,
using an individual-level estimation of wood density will remain
the better option.