TITLE: Definitions of drylands
DATE: 2024-03-15
AUTHOR: John L. Godlee
====================================================================
I've read a few papers that refer to "drylands" and "semi-arid"
ecosystems, and I became interested in the definitions of these
terms, so here I've gathered together some notes on my reading,
with the aim of tracing back the definitions through the literature.
Ahlstrom et al. (2015) is a DGVM modelling study that looks at the
contribution of different regional terrestrial ecosystem types to
the temporal trend and temporal variability of the global land
carbon sink. They find that "semi-arid" ecosystems dominate the
trend and inter-annual variability of the sink, with these temporal
variations being strongly associated with inter-annual variation in
precipitation. They define semi-arid ecosystems alongside five
other land cover classes: tropical forest, extra-tropical forest,
tundra and arctic shrubland, grassland and agriculture, and barren
(sparsely vegetated). First they divide into forest, savanna and
shrublands, and grasslands and croplands using the MODIS land cover
classification (MCD12C1 type 3). They then divide the savanna and
shrubland class into two based on latitude. Below 45N they class as
semi-arid, and above 45N they class as tundra and arctic shrubland.
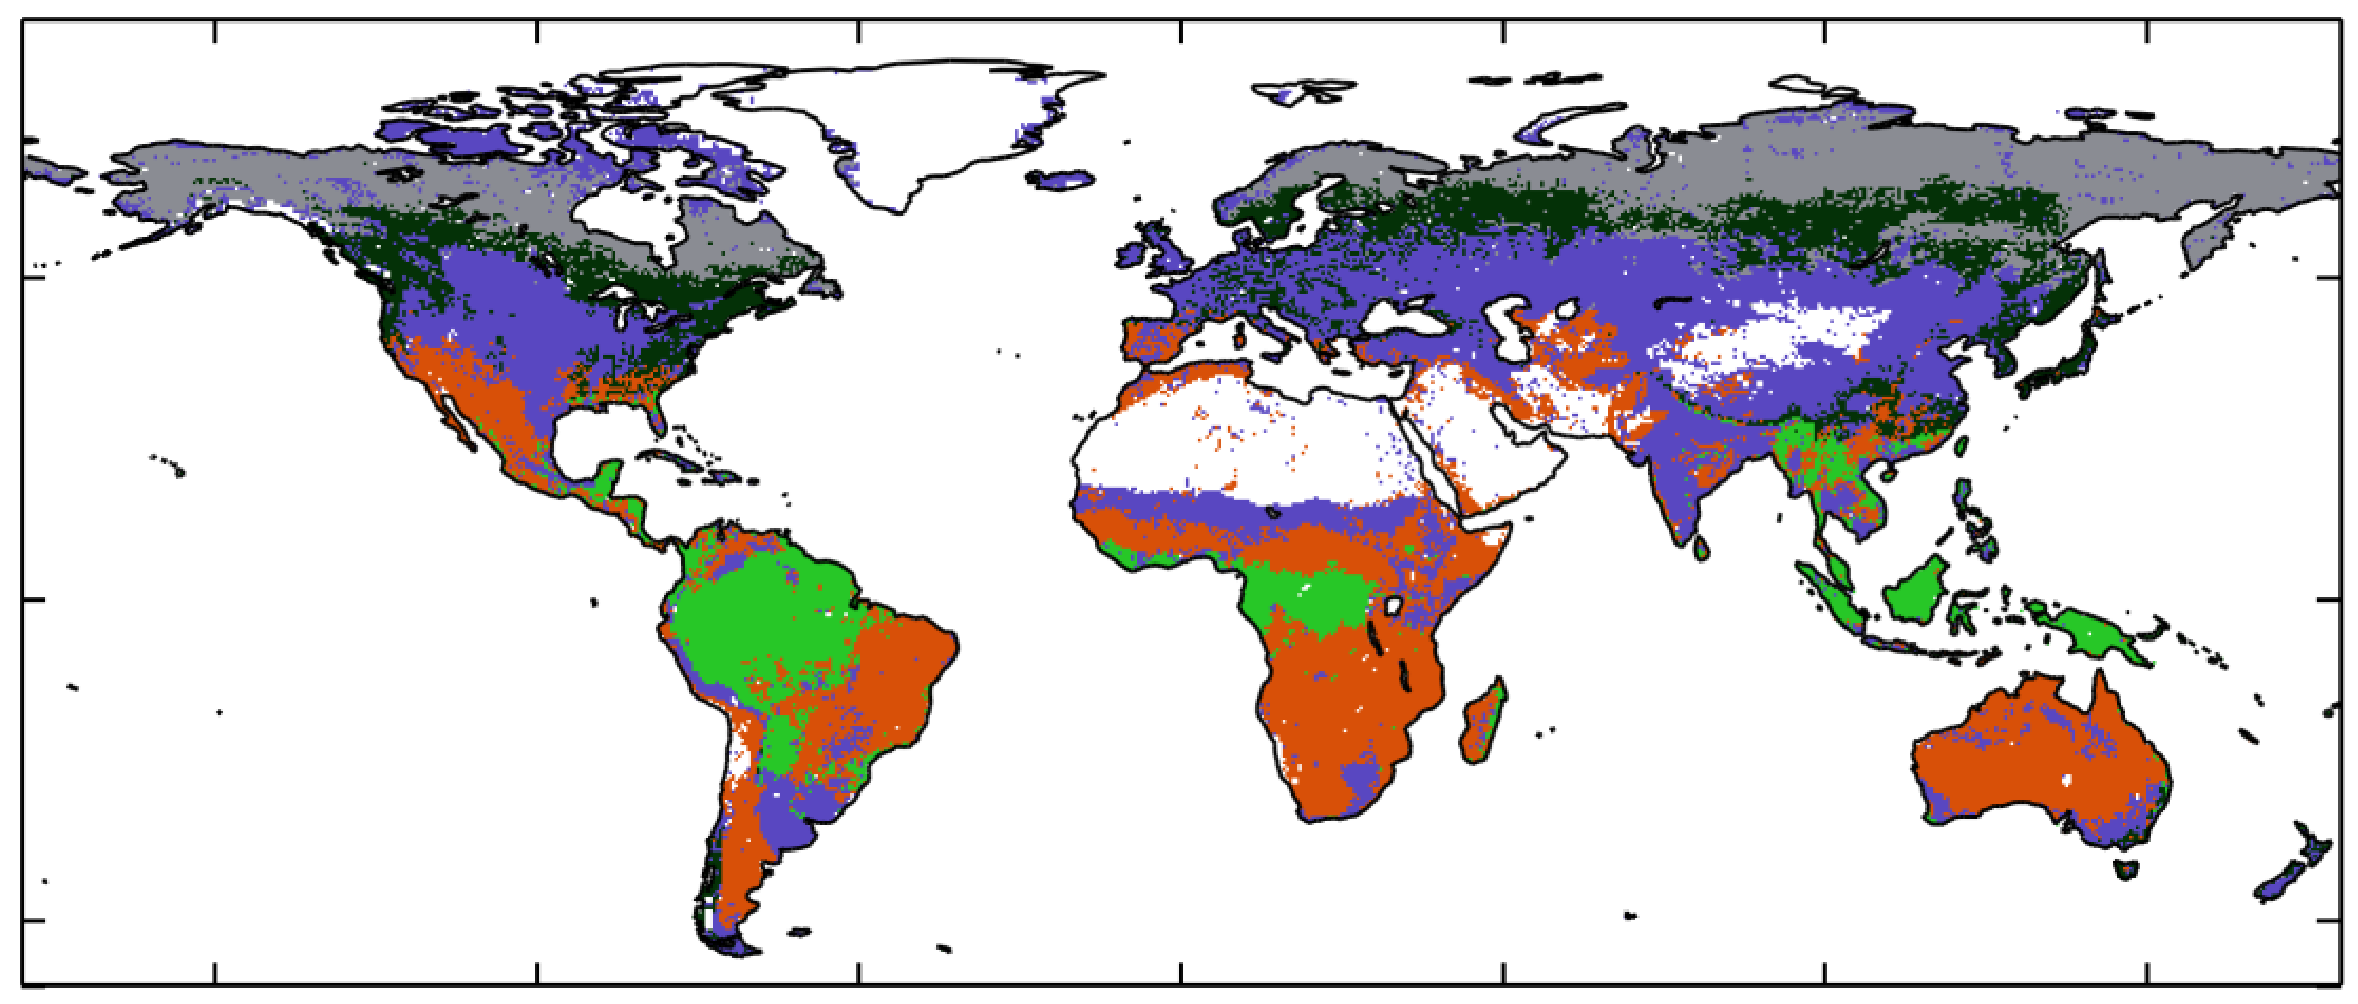
Below is their map of land cover classes. Tropical forests in light
green, extra-tropical forests in dark green, semi-arid in orange,
tundra and arctic shrubland in grey, grassland and cops in blue,
barren in white.
MacBean et al. (2021) can be seen in a way as a follow up to
Ahlstrom et al. (2015). They use the same DGVM model ensemble
(TRENDY v7) to evaluate the suitability of these models in
modelling carbon dynamics in semi-arid systems. They find that all
models under-estimate both the mean annual C uptake/release, as
well as the magnitude of NEE IAV, and that the sensitivity and
timing of ecosystem C uptake to plant available moisture was the
issue, where models under-estimated the response of GPP to water
availability during the wet season. MacBean et al. assert that
drylands "cover more than 40% of the world surface". For this
statistic they cite Schimel (2010).
Schimel (2010) actually says that drylands cover about 45% of the
Earth's land surface, but they don't cite this statistic or show
their working. Schimel (2010) is itself a cover piece for Rotenberg
and Yakir (2010), which appears in the same issue of Science, so I
guess they are implicitly referencing that article.
Rotenberg and Yakir (2010) quote that semi-arid regions cover 2.4
billion ha, ~17.7% of total land surface area, and for this
statistic they cite (Lal 2004). Rotenberg and Yakir (2010) is a
study of one particular semi-arid pine forest in southern Israel
called Yatir, whee there is a flux tower. They measured fluxes of
CO2, water vapour and photosynthetic activity.
Lal (2004) defines drylands as regions in which the ratio of total
annual precipitation (P) to potential evapotranspiration (PET)
(Aridity Index, P:PET), ranges from 0.05 to 0.65. They say these
regions cover 6.15 billion ha, 47.2% of earth's land area. Lal
(2004) is sort of a review article on the importance of dryland
ecosystems in the carbon cycle.
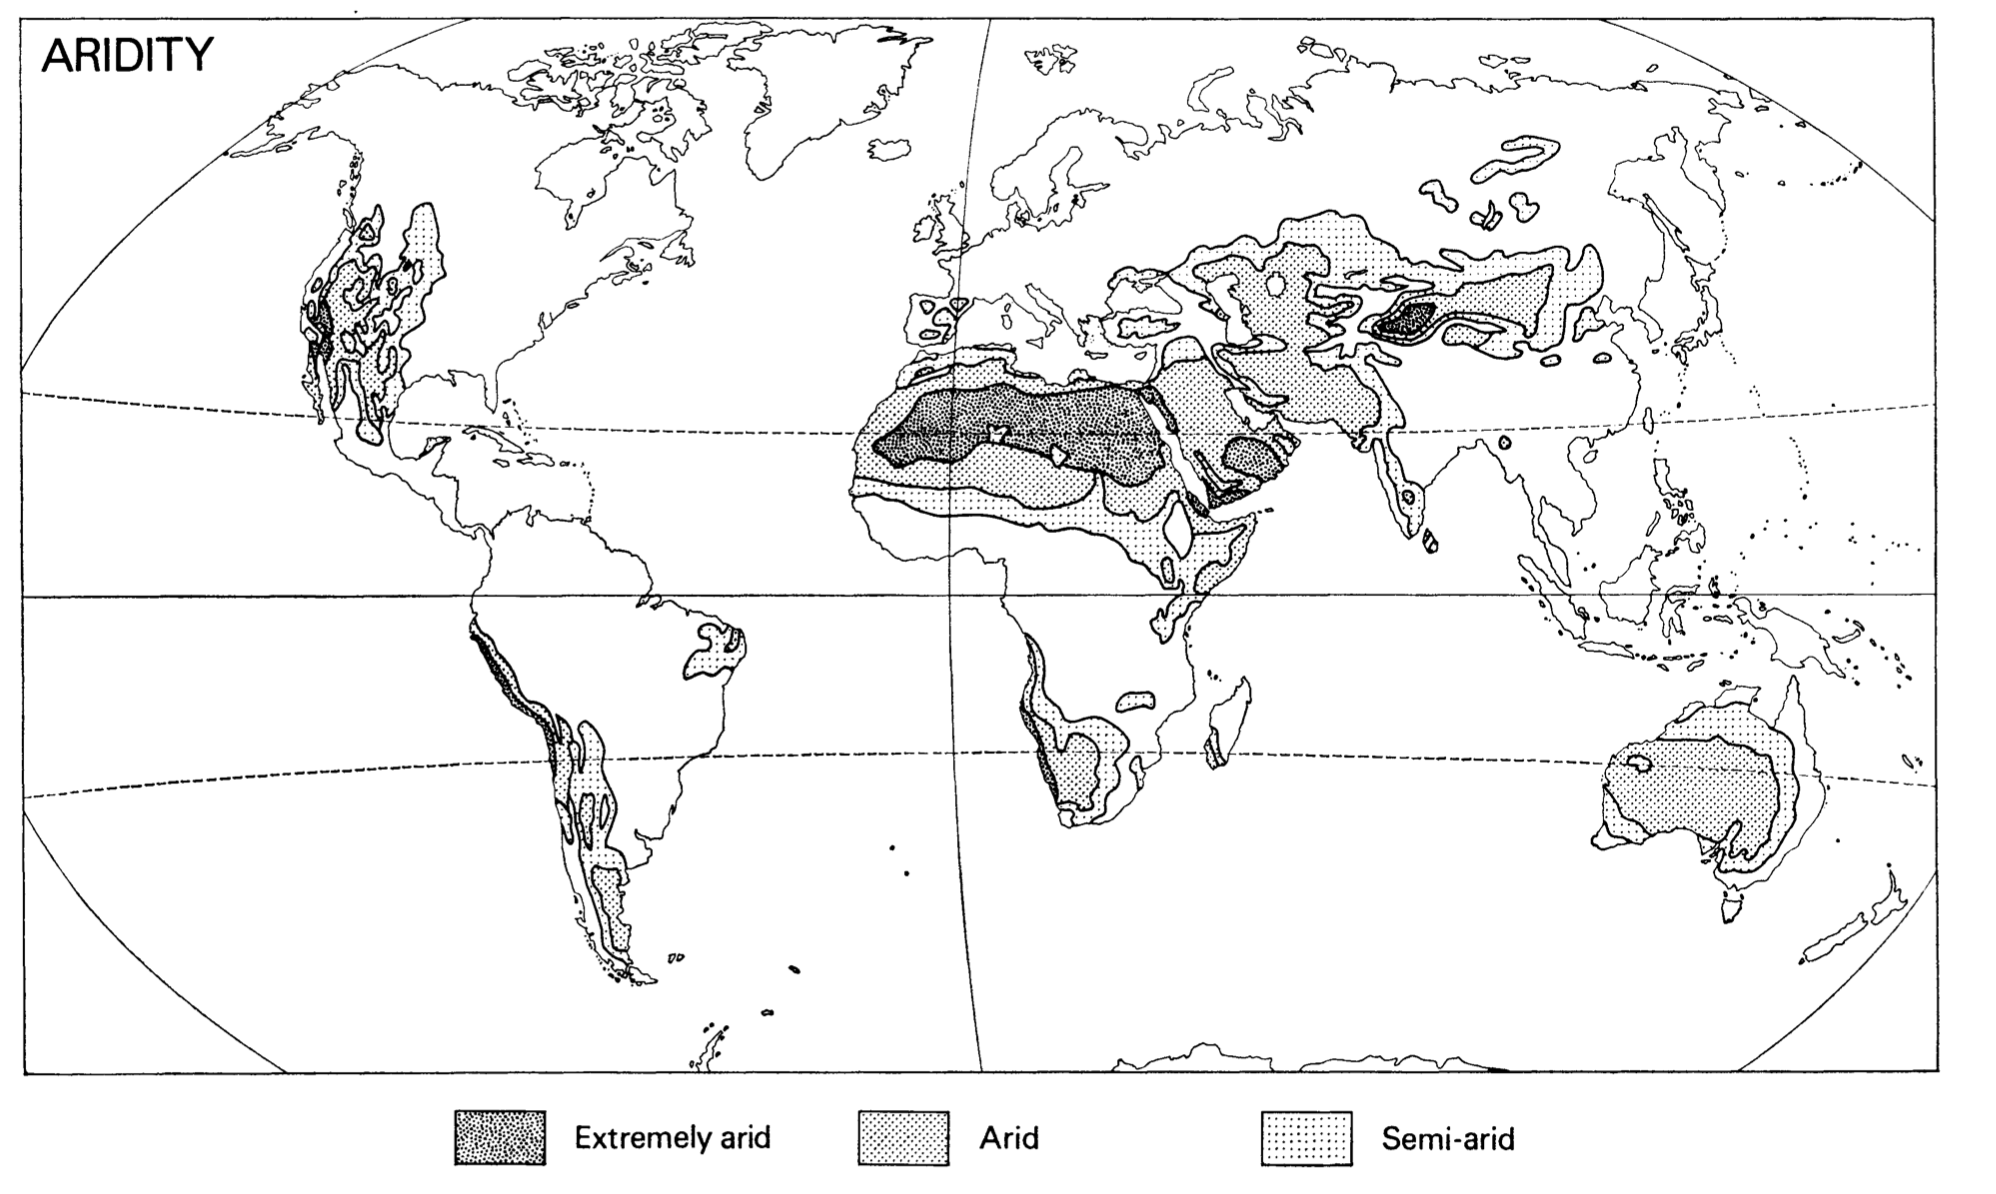
The aridity index values and classifications quoted in Lal (2004)
come from UNEP (Middleton and Thomas 1997), the World Atlas of
Desertification, 2nd edition, specifically pages 5-7. In this they
define multiple aridity zones bounded by the Aridity Index P:PET:
- Humid >0.65
- Dry sub-humid 0.5-0.65
- Semi-arid 0.2-0.5
- Arid 0.05-0.2
- Hyper-arid <0.05
In this chapter, Middleton and Thomas say that their classification
comes fom an earlier iteration used in the UNSECO (1977) map of
aridity. The boundaries between arid and hyper-arid zones, and dry
sub-humid and humid zones were changed for the 1997 map, after they
found that PET was being under- and over-estimated in very dry and
moist climates, respectively. They also introduced a separate cold
and mountains zone, acknowledging that while these areas may be
arid, they present a different range of environmental issues than
warm dryland environments.
Heathcote (1983), in The Arid Lands: Their Use and Abuse, observes
that the UNSECO (1977) map is very similar to the map of Meigs
(1953), which was also prepared for UNESCO for their extended
project on drylands, which ran between 1951 and 1964. The maps in
Meigs (1953) use a different aridity index to UNESCO (1977). Meigs
uses the Thornthwaite (1948) climate classification, which uses an
aridity index of 100(d/n), where d is the sum of monthly
differences between P and PET for those months when the average
precipitation is less than the average evapotranspiration, and n is
the sum of monthly values of PET for the deficient months. Grove et
al. (1977) shows that Meigs' definition of extremely arid lands
aligns well with areas receiving less than 25 mm annual rainfall or
at least 12 consecutive months without rainfall, arid as 25-200 mm,
semi-arid as 200-500 mm.
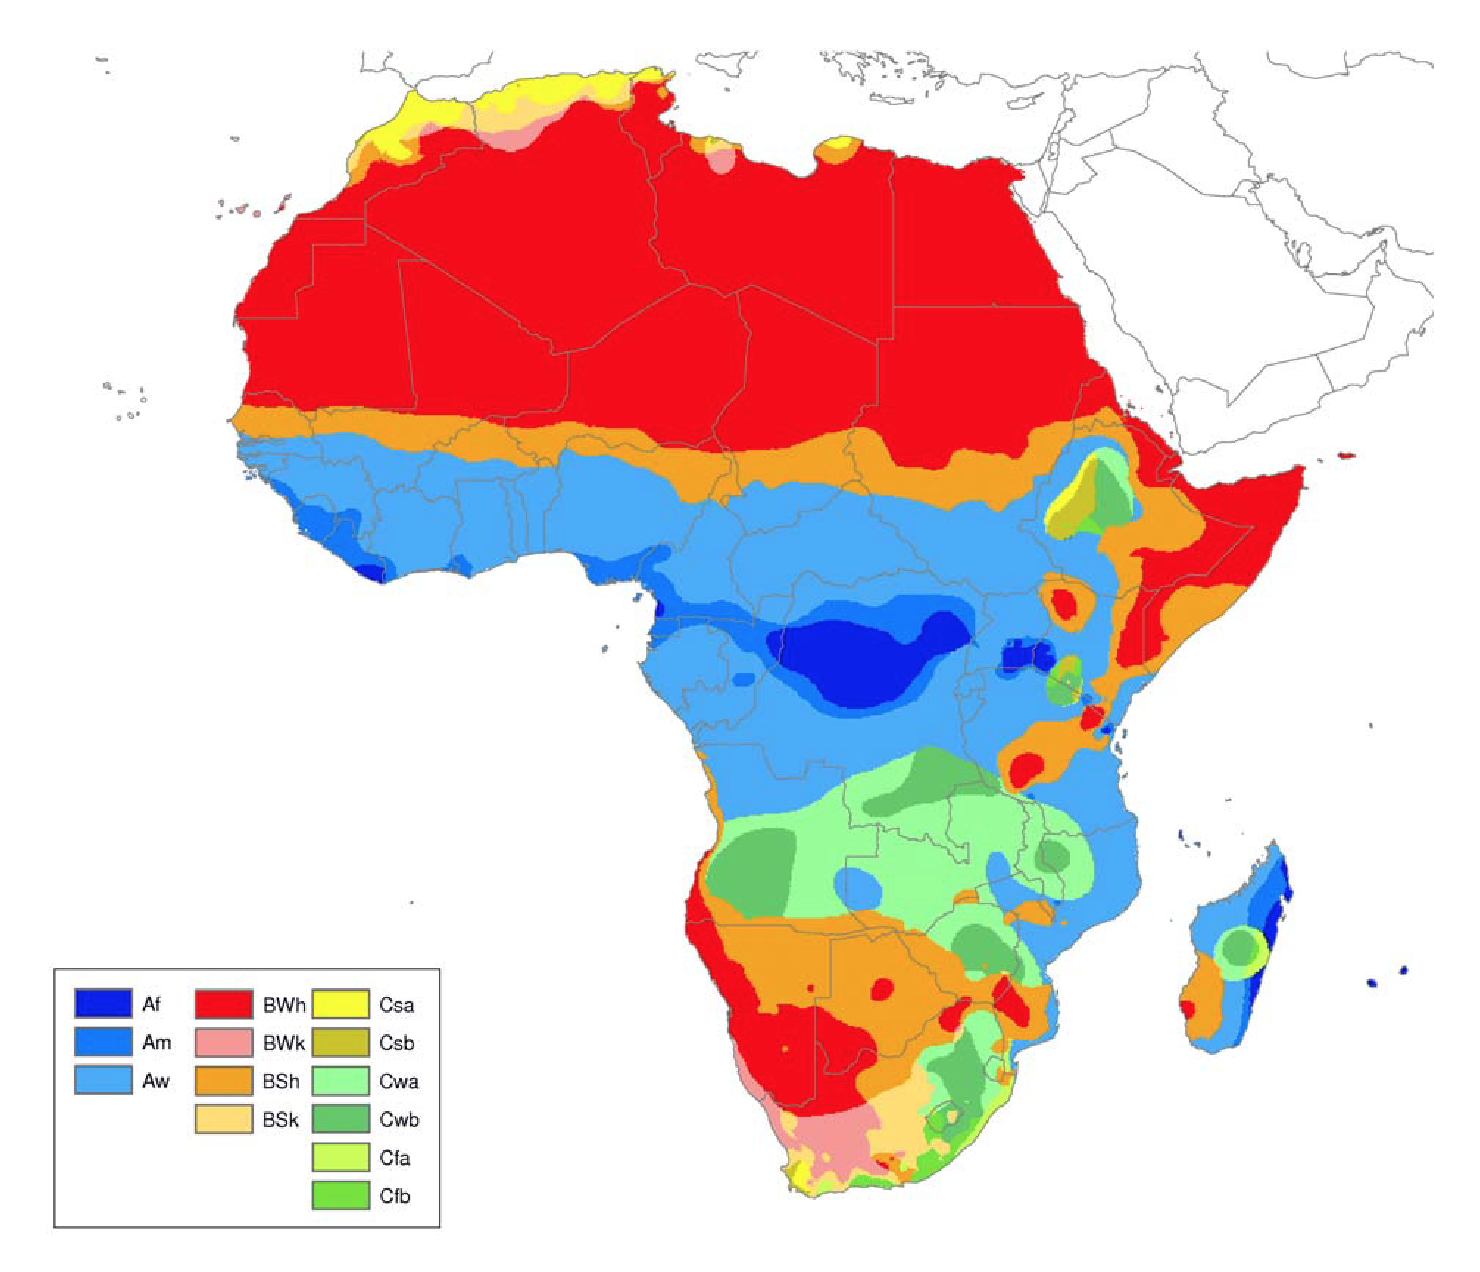
The Köppen-Geiger climate classification (Köppen 1884, Peel et
al. 2007) uses a mixture of temperature and precipitation
thresholds to define arid areas, as well as tropical, temperate,
cold and polar, with subgroups. Ahlstrom et al. (2015) reference
the Köppen-Geiger classification in their classification of
tropical and extra-tropical forests, but they don't use it to
classify semi-arid regions. In the Köppen-Geiger classification,
arid areas are defined as areas where mean annual precipitation
(MAP) is less than 10x a key precipitation threshold. The
precipitation threshold is 2x mean annual temperature (MAT) if 70%
or more of MAP occurs in the cooler six months of the year,
2xMAT+28 if 70% or more of MAP occurs in the warmer six months of
the year, or otherwise 2xMAT+14.
The FAO defines arid zones as those areas where the length of the
growing period is less than 180 days (FAO 2000); this includes
regions classified climatically as arid, semi-arid and dry
sub-humid (from Gaur 2018).
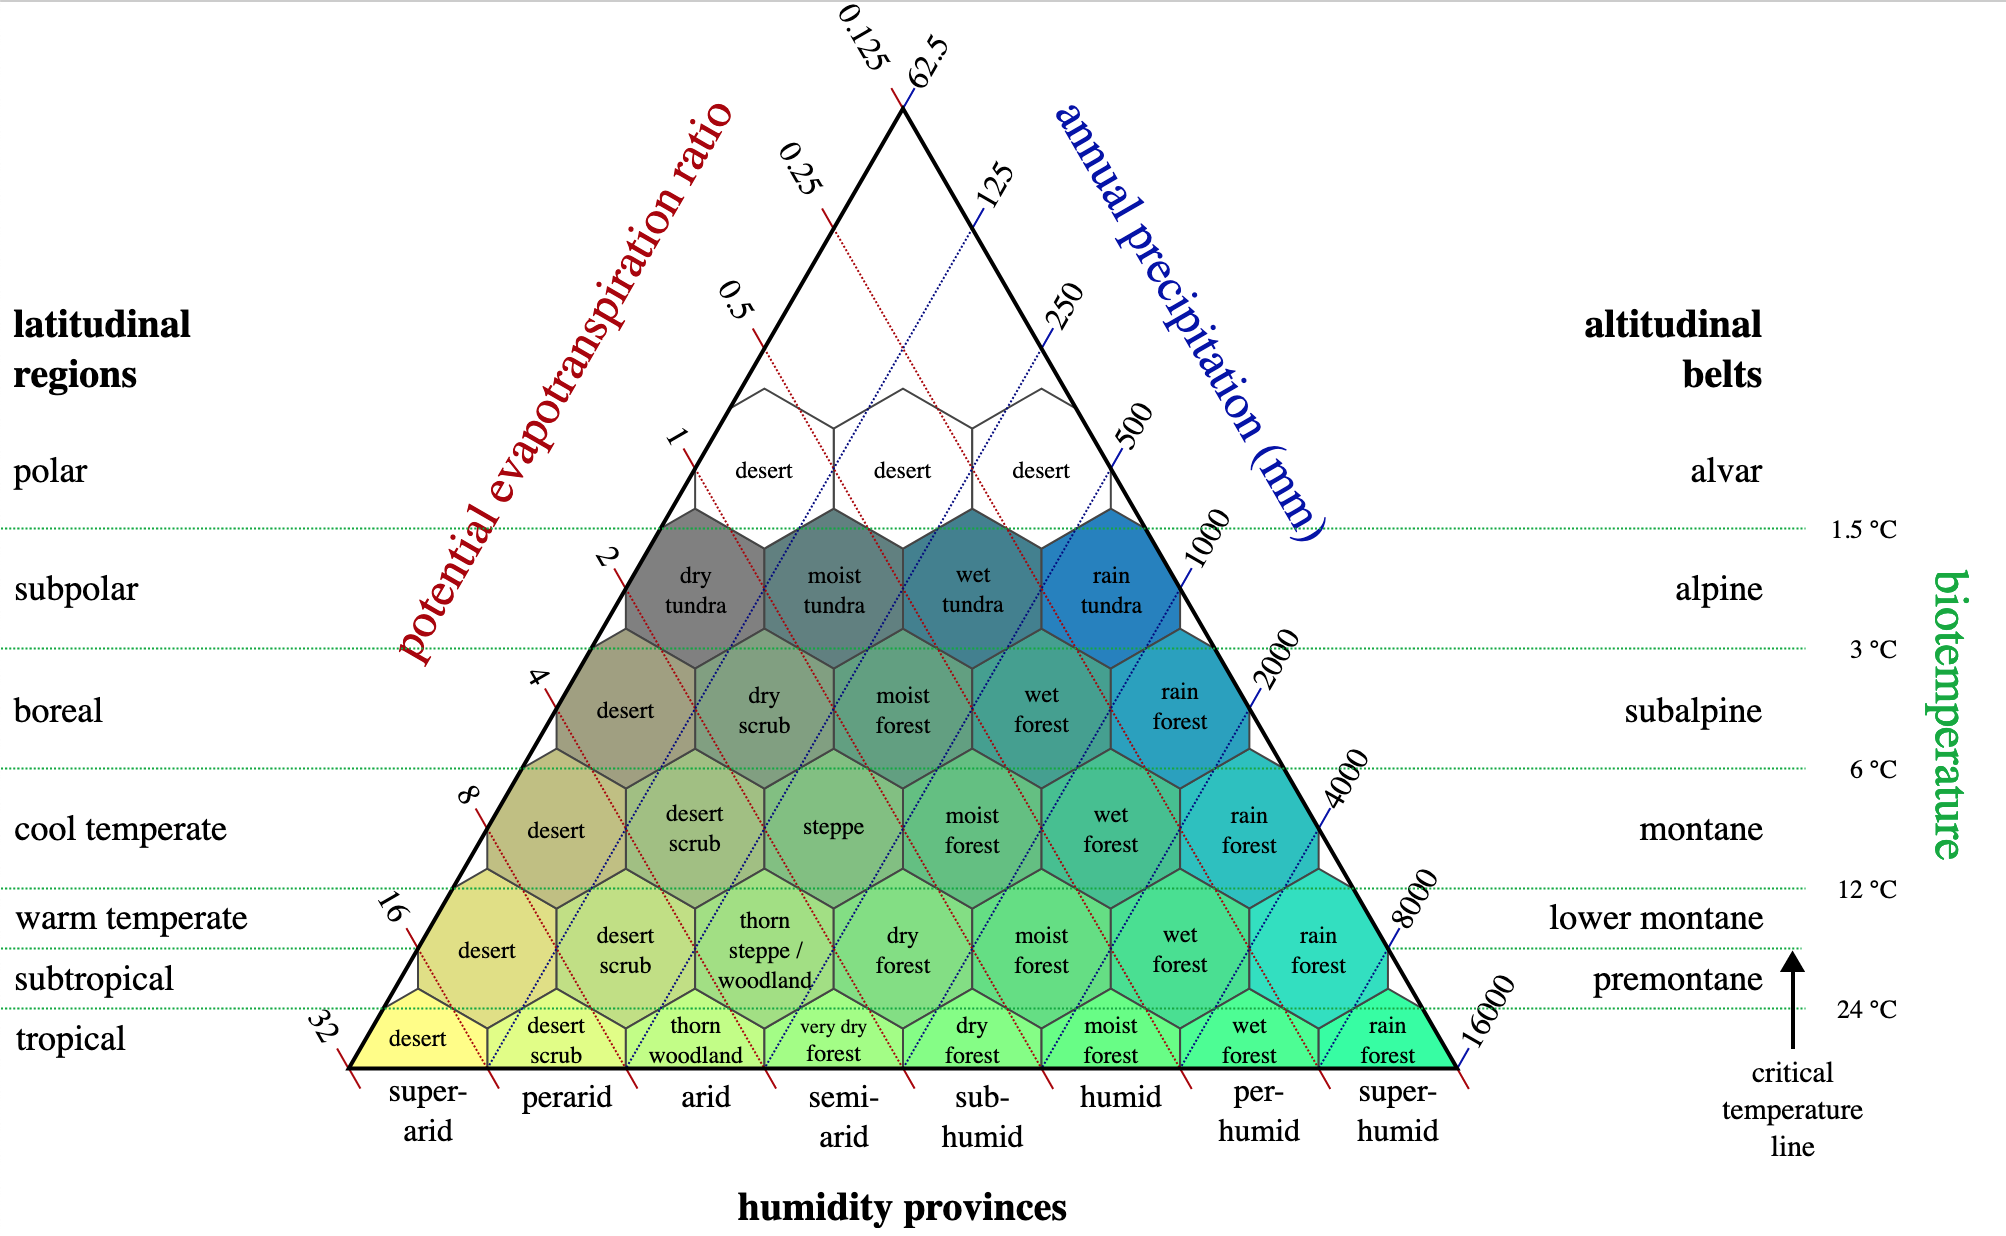
The Holdridge life zones (Holdrige 1947, 1967), determine semi-arid
regions as having an aridity index P:PET value less than
approximately 0.5.
Other definitions in the literature
Here I am compiling a list opportunistically of other definitions
of drylands and semi-arid ecosystems, as I encounter them in the
literature.
Kindt (2023) - "Dryland locations were defined by a
CMI < -0.35", where CMI is the Climatic Moisture Index, aka the
aridity index P:PET as used by Middleton and Thomas (1997).
[Kindt (2023)]:
https://doi.org/10.1111/gcb.16914
Wang et al. (2022) - "Drylands are commonly defined as regions
where precipitation is substantially smaller than atmospheric water
demand (as quantified by potential evapotranspiration, PET). They
are the largest biome on Earth (Schimel 2010), covering about 40%
of the terrestrial land surface"
[Wang et al. (2022)]:
https://doi.org/10.1038/s41558-022-01499-y