TITLE: Methods to establish square vegetation monitoring plots
DATE: 2024-03-07
AUTHOR: John L. Godlee
====================================================================
Creating perfectly square permanent plots in dense woodland
ecosystems can be a challenge. It's very easy to end up with
something more like a diamond or a rhombus, unless care is taken to
measure the diagonals of the plot.
Previously I have set up one hectare permanent woodland tree
sampling plots by starting at the SW corner of the plot, then
running tapes at 90° going N and E for 100 m to form the W and S
edges, respectively. Then to ensure that the edges are actually at
90° you run a tape along the hypotenuse of those edges, which
should be 141.42 m long. Then you construct the other two edges (N,
E), ensuring that they meet at 100 m, and finally check the length
of the other hypotenuse is 141.42 m. The principal drawback of this
method is that it requires a tape measure that can cover 141.42 m,
or else you have to mess about with two tapes or a long piece of
string. Covering a straight distance of 141.42 m is difficult
because you often can't see the person standing at the opposite
corner. Using 100 m tapes, this method requires a minimum of six
tapes. Alternatively you can measure smaller hypotenuse angles at
intermediate points along the edges, e.g. at 10 and 25 m, but this
means you will have to do many more measurements.
Below I present an alternative method that I think overcomes these
problems.
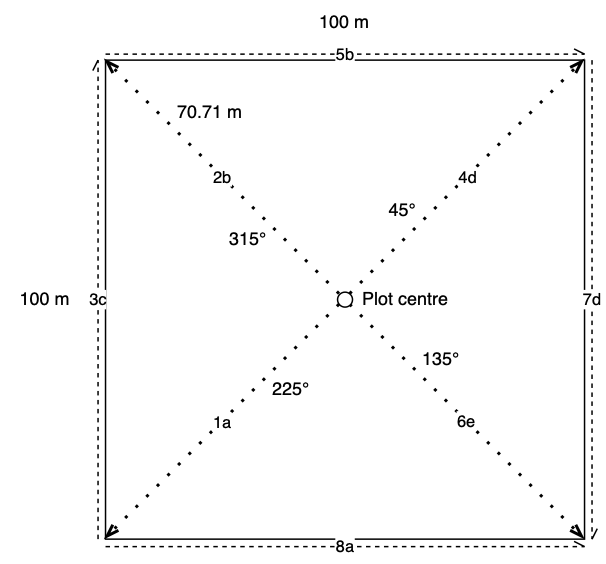
Start in the centre of the plot. Run a tape measure going SW
(225°) to 70.71 m, using a sighting compass to guide. Run another
tape going NW (315°), also to 70.71 m. Run a tape measure between
the ends of these two tapes, which should equal 100 m. Adjust the
NW tape to get 100 m. Run a tape going NE (45°) to 70.71 m. Run a
tape from NW to NE, which should equal 100 m. Adjust the NE tape to
get 100 m. Run a tape going SE (135°) to 70.71 m. Run a tape from
NE to SE, and another from SW to SE. Triangulate all three tapes
running to the SE corner to get 100 m along the edges.
This process requires only five 100 m tapes and means that you
don't have to span 141.42 m to traverse the full diagonal of the
plot.
It requires 5 metal poles. One for each corner and one for the
centre.
The diagram below shows the layout of tape measures to create a
plot in this way. The dotted lines show temporary tape measures,
while the dashed lines show permanent tape measures, which form the
edges of the plot. The tape measure lines are numbered in the order
they should be laid out. The letters next to the numbers (a-e)
identify the tape measures. See that line 2b and 5b use the same
tape measure, for example.
If you did want to stick with the method where you start at the SW
corner but wanted to avoid the problem of running a tape 141.42 m
along the hypotenuse of the entire plot, you could do hypotenuse
measurements at intermediate points, e.g. 25 m (35.36 m) and 50 m
(70.71 m). This eliminates the need for tapes longer than 100 m,
but does require four or more measures of the hypotenuse, one for
each pair of edges.