TITLE: siunitx 'S' table column 'table-format' option
DATE: 2021-08-01
AUTHOR: John L. Godlee
====================================================================
I can't believe it's taken me this long to figure out how to use
the table-format option of the S column type from the siunitx
package in a LaTeX table!
A basic table in LaTeX, showing part of the mtcars dataset in R:
\begin{table}[h]
\centering
\begin{tabular}{lrrrrr}
\hline
& {mpg} & {cyl} & {disp} & {drat} & {qsec} \\
\hline
Mazda RX4 & 21 & 6 & 160 & 3.9 & 16.46 \\
Mazda RX4 Wag & 21 & 6 & 160 & 3.9 & 17.02 \\
Datsun 71 & 22.8 & 4 & 108 & 3.85 & 18.61 \\
Hornet 4 Drive & 21.4 & 6 & 258 & 3.08 & 19.44 \\
Hornet Sportabout & 18.7 & 8 & 360 & 3.15 & 17.02 \\
Valiant & 18.1 & 6 & 225 & 2.76 & 20.22 \\
\hline
\end{tabular}
\end{table}
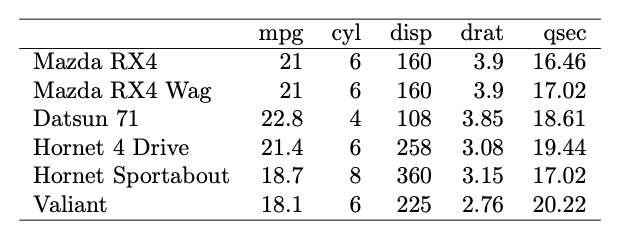
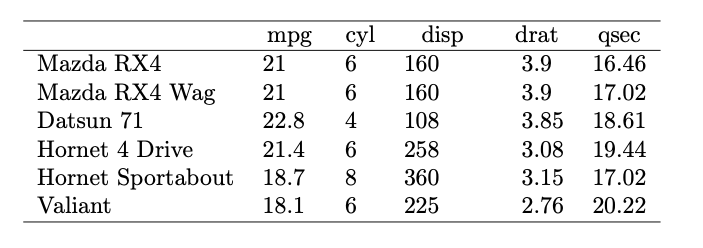
It's nice to align numeric columns by decimal point, which can be
achieved using the S column type:
\begin{tabular}{lSSSSS}
But now the columns are all off centre:
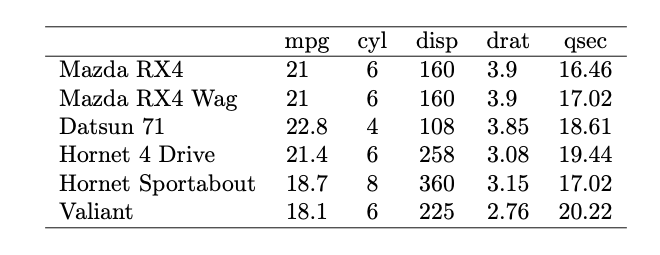
It turns out, that the table-format option can be used to tell
siunitx how many digits to expect both before and after the decimal
point:
\begin{tabular}{l
S[table-format=2.1]
S[table-format=1.0]
S[table-format=3.0]
S[table-format=1.2]
S[table-format=2.2]}
I had always assumed that table-format referred to a version
number, v3.2 for example, and not knowing what the differences were
I had avoided using the option altogether.
As an addendum, while I was figuring this out I also did some
experiments in exporting nice looking LaTeX tables directly from R
using the xtable package. Here is a basic xtable export snippet,
the resulting table, and the table rendered by LaTeX:
# Packages
library(xtable)
# Data
data(mtcars)
dat <- head(mtcars)[,c(1,2,3,5,7)]
# Basic xtable, no formatting
xtab_bad <- xtable(dat)
# Write basic xtable to file
fileConn <- file("xtab_bad.tex")
writeLines(print(xtab_bad),
fileConn)
close(fileConn)
% latex table generated in R 4.1.0 by xtable 1.8-4 package
% Mon Aug 2 08:50:05 2021
\begin{table}[ht]
\centering
\begin{tabular}{rrrrrr}
\hline
& mpg & cyl & disp & drat & qsec \\
\hline
Mazda RX4 & 21.00 & 6.00 & 160.00 & 3.90 & 16.46 \\
Mazda RX4 Wag & 21.00 & 6.00 & 160.00 & 3.90 & 17.02 \\
Datsun 710 & 22.80 & 4.00 & 108.00 & 3.85 & 18.61 \\
Hornet 4 Drive & 21.40 & 6.00 & 258.00 & 3.08 & 19.44 \\
Hornet Sportabout & 18.70 & 8.00 & 360.00 & 3.15 & 17.02 \\
Valiant & 18.10 & 6.00 & 225.00 & 2.76 & 20.22 \\
\hline
\end{tabular}
\end{table}
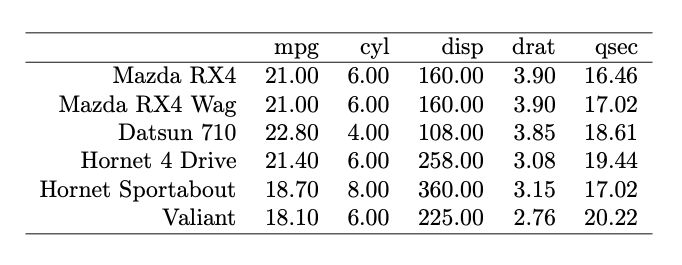
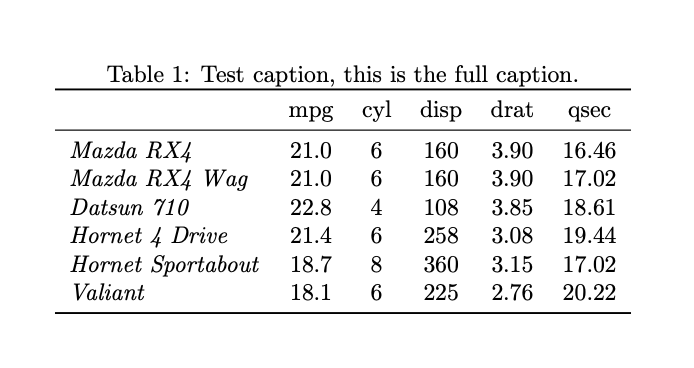
By default, xtable renders all columns as right-aligned, with two
decimal places after columns identified as numeric, with no caption
or label. Below is an improved table, created by adding some
customisations to xtable:
xtab_good <- xtable(dat,
label = "table_a",
align = c("l", "S[table-format=2.1]", "S[table-format=1.0]",
"S[table-format=3.0]", "S[table-format=1.2]",
"S[table-format=2.2]"),
display = c("s", "f", "d", "d", "f", "f"),
digits = c( 0, 1, 0, 0, 2, 2),
caption = c("Test caption, this is the full caption.",
"Testing short"))
colSanit <- function(x){
paste0("{", x, "}")
}
rowSanit <- function(x){
paste0("{\\emph{", x, "}}")
}
# Write better xtable to file
fileConn <- file("xtab_good.tex")
writeLines(print(xtab_good,
include.rownames = TRUE,
caption.placement = "top",
table.placement = "",
booktabs = TRUE,
sanitize.colnames.function = colSanit,
sanitize.rownames.function = rowSanit,
sanitize.text.function = function(x) {x}),
fileConn)
close(fileConn)
% latex table generated in R 4.1.0 by xtable 1.8-4 package
% Mon Aug 2 08:53:54 2021
\begin{table}
\centering
\caption[Test caption, this is the full caption.]{Testing
short}
\label{table_a}
\begin{tabular}{lS[table-format=2.1]S[table-format=1.0]S[table-forma
t=3.0]S[table-format=1.2]S[table-format=2.2]}
\toprule
& {mpg} & {cyl} & {disp} & {drat} & {qsec} \\
\midrule
{\emph{Mazda RX4}} & 21.0 & 6 & 160 & 3.90 & 16.46 \\
{\emph{Mazda RX4 Wag}} & 21.0 & 6 & 160 & 3.90 & 17.02 \\
{\emph{Datsun 710}} & 22.8 & 4 & 108 & 3.85 & 18.61 \\
{\emph{Hornet 4 Drive}} & 21.4 & 6 & 258 & 3.08 & 19.44 \\
{\emph{Hornet Sportabout}} & 18.7 & 8 & 360 & 3.15 & 17.02 \\
{\emph{Valiant}} & 18.1 & 6 & 225 & 2.76 & 20.22 \\
\bottomrule
\end{tabular}
\end{table}
The changes made:
- Adds a label - label =
- Aligns each column differently with S columns - align =
- Enforces column content type - display =
- Rounds digits in numeric columns - digits =
- Adds both a short caption for the list of tables and a long
caption for in the text - caption =
- Defines functions to sanitize both the column names and the row
names - colSanit(), rowSanit()
- Includes the rownames - include.rownames =
- Puts the caption above the table, which should be standard
behaviour in my opinion - caption.placement =
- Removes any table position forcing, better to do this in LaTeX
- table.placement =
- Uses booktabs to add toprule, midrule, bottomrule - booktabs =