TITLE: Diagrams to summarise Biodiversity - Ecosystem Function
Research
DATE: 2021-06-01
AUTHOR: John L. Godlee
====================================================================
I've been writing the background and introduction chapter of my PhD
thesis. In it, I write about previous research into the
"Biodiversity - Ecosystem Function Relationship", the idea that
variation in biodiversity affects the way ecosystems function. To
visualise some of the breakthroughs over the last 30 or so years I
decided to make a schematic diagram. The diagram is below, with the
lengthy caption I included in the chapter.
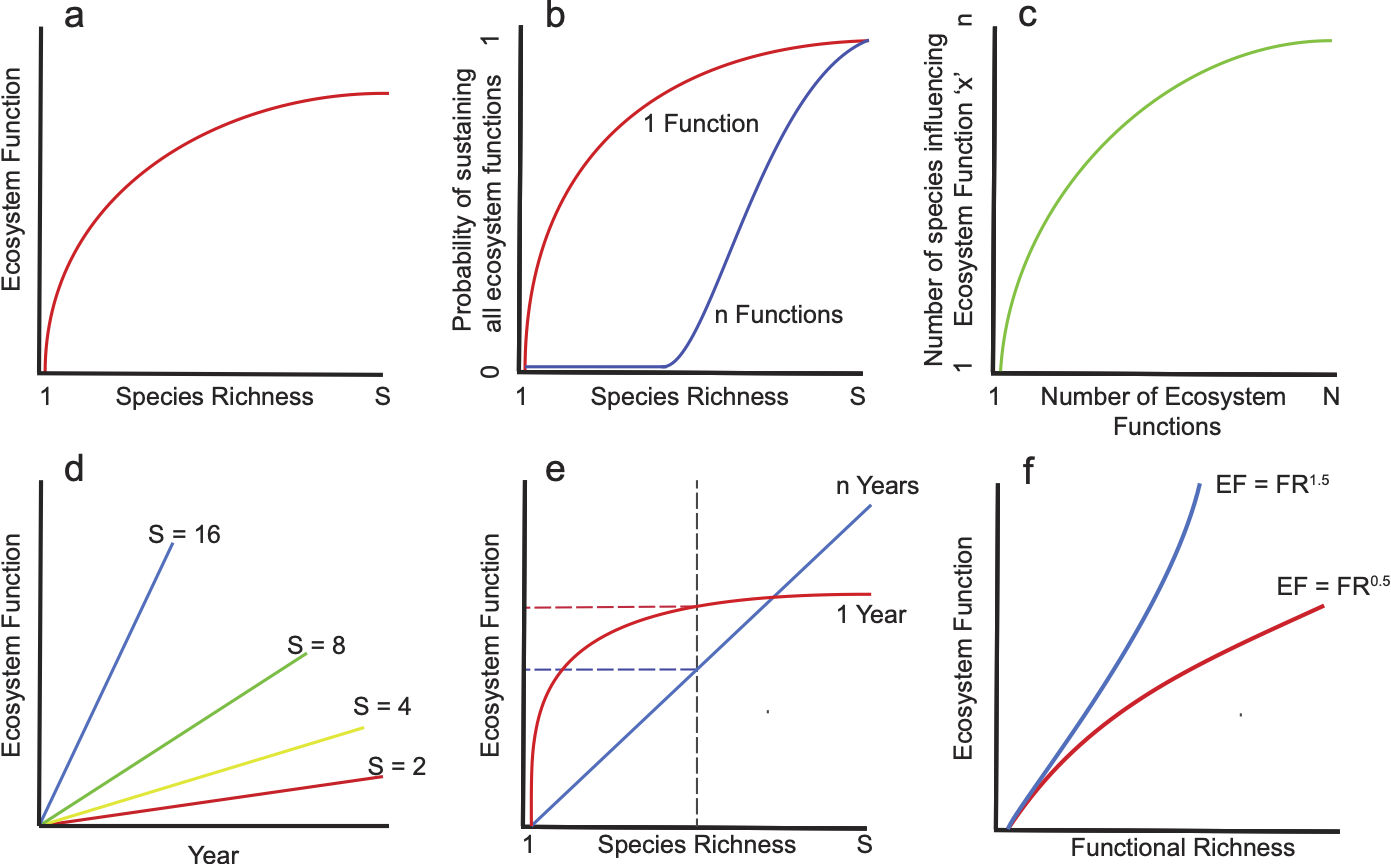
Schematic diagrams illustrating various inferences made on the
Biodiversity - Ecosystem Function Relationship by previous studies.
a) The classic BEF relationship found by many small scale
experiments (Cardinale, Srivastava, et al., 2009). b) As more
functions are considered simultaneously the minimum species
richness needed to maintain overall ecosystem functionality
increases, also showing how the proportion of functionally
redundant species increases as less functions are considered (i.e.
the curve reaches asymptote at a lower species richness) (Hector
and Bagchi, 2007). c) The saturating relationship of the number of
ecosystem functions considered and the number of species
influencing ecosystem multifunctionality (Hector and Bagchi, 2007).
d) As studies progress through time the strength of the BEF
relationhip increases, the rate of increase in ecosystem function
increases as species richness (S) grows (Cardinale, J. P. Wright,
et al., 2007). e) As studies progress through time the shape of the
relationship becomes more linear, saturating at progressively
higher species richnesses. Studies averaged over longer periods
exhibit a greater loss in ecosystem function in response to an
equivalent species richness reduction (Reich, D. Tilman, et al.,
2012). f) When functional richness is used in place of species
richness, the relationship reaches asymptote at a higher richness.
Additionally the relationship becomes more concave as a power
coefficient representing the strength and number of species
interactions increases. FR gt1 (interspecific competition greater
than intraspecific competition (unstable)) results in a convex
relationship, while FR lt1 results in a concave relationship (Mora,
Danovaro, and Loreau, 2014).