TITLE: ASCII charts in R
DATE: 2021-04-30
AUTHOR: John L. Godlee
====================================================================
I was inspired by a blog post on Gemini that was talking about
uploading gemtext summaries of their academic research. The writer
of the post wanted to avoid images where simple ASCII graphics
would do, so I had a look to see if I could make simple ASCII
scatter charts. Most of the answers on this Stackoverflow post
mention using gnuplot, with varying degrees of hackery to get
around how difficult gnuplot is to work with. I use R for nearly
all my basic data visualisation, so I decided instead to write a
script in R. The {txtplot} package has done the bulk of the real
work already. I only had to write a wrapper that makes it
convenient to pass values from the command line:
[Stackoverflow post]:
https://stackoverflow.com/questions/123378/command-line-unix-ascii-b
ased-charting-plotting-tool
[{txtplot}]:
https://cran.r-project.org/web/packages/txtplot/index.html
#!/usr/bin/env Rscript
args <- commandArgs(trailingOnly=TRUE)
argsLen <- length(args)
if (argsLen > 3) stop("Too many arguments")
if (argsLen < 1) stop("Must supply CSV with two columns")
infile <- args[1]
if (argsLen == 2) {
pwidth <- round(as.numeric(args[2]))
} else {
pwidth <- round(options()$width*0.8)
}
if (argsLen == 3) {
pheight <- round(as.numeric(args[3]))
} else {
pheight <- round(0.25*pwidth)
}
if (!file.exists(infile)) {
stop("File path invalid")
}
dat <- read.csv(infile)
if (ncol(dat) != 2) {
stop("CSV must have only two columns")
}
txtplot::txtplot(dat[,1], dat[,2],
width = pwidth, height = pheight,
xlab = names(dat)[1], ylab = names(dat)[2])
Here is an example. First the base R plot of the data:
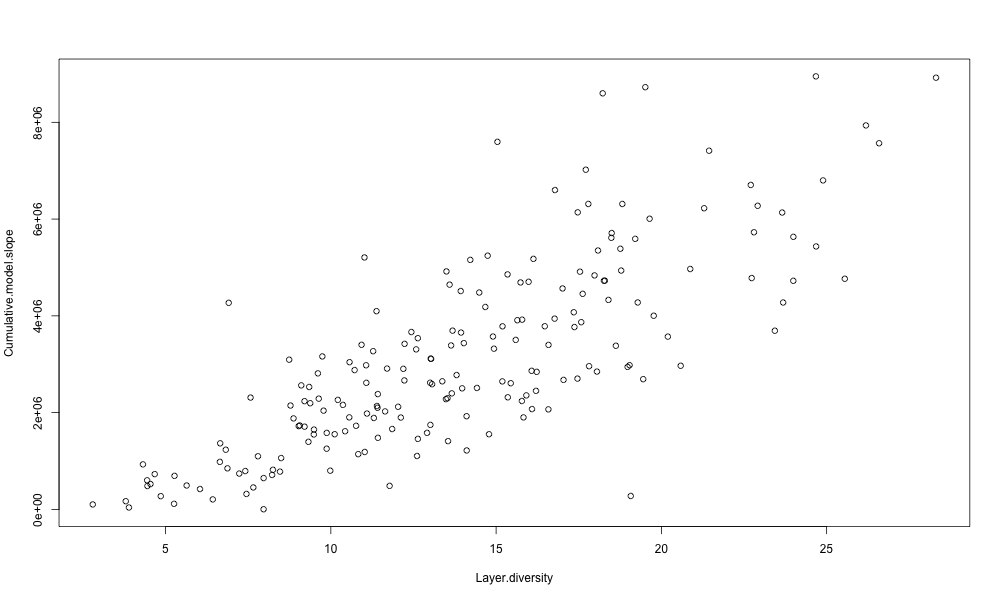
And now the ASCII representation, generated with asciichart
test.csv:
+------+---------+--------+---------+---------+--------+
C | * * * * |
u 8e+06 + * ** +
m | * * * |
u | *** ** * *** |
l 6e+06 + **** * ** +
a | * ************ * * * * |
t 4e+06 + * * ******* * ** * +
i | * * ** **** * ** ** * * |
v | * *********** ****** ** * |
e 2e+06 + ********* ** ** +
. | ** ********** * ** |
m 0 + * ******* ** * * +
o +------+---------+--------+---------+---------+--------+
5 10 15 20 25
Layer.diversity