TITLE: Empirical Cumulative Density Function (ECDF) plots
DATE: 2021-04-15
AUTHOR: John L. Godlee
====================================================================
Twice recently I've wanted to check the proportional coverage of a
dataset. For example, I have a dataset where trees are nested
within plots. I wanted to check what proportion of trees within
each plot had measurements in the TRY global trait database for
leaf nitrogen per dry mass. Specifically, I wanted to check what
proportion of plots had at least a given proportion of trees or
more represented in TRY.
[TRY global trait database]:
https://www.try-db.org/
I could have visualised this with a histogram, but it's not very
visually appealing because it requires some mental gymnastics to
add up each bin greater than the minimum threshold:
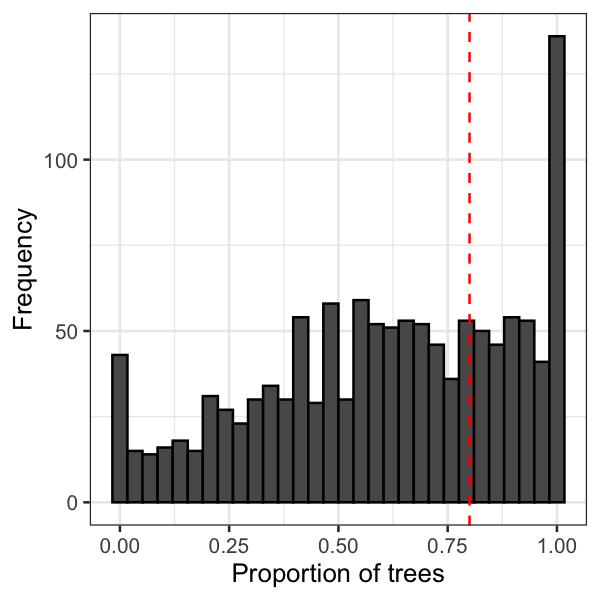
A better method I've found is an Empirical Cumulative Density
Function (ECDF) plot.
First I have the dataframe, where each row is a tree, with plot ID,
species, and mean leaf nitrogen per dry mass for that species. If a
species doesn't have a nitrogen measurement, it's recorded as NA:
plot species leaf_n
-------- ----------------------- --------
JLG_10 Combretum collinum 24.29
JLG_10 Pericopsis angolensis NA
JLG_10 Pericopsis angolensis NA
JLG_10 Burkea africana 20.72
JLG_10 Burkea africana 20.72
JLG_10 Burkea africana 20.72
Then I calculate the proportion of trees with trait measurements:
# Split stems data by plot
dat_split <- split(dat, dat$plot)
# For each plot, proportion of trees and ba represented for
each trait
prop <- do.call(rbind, lapply(dat_split, function(x) {
n_trees <- nrow(x)
data.frame(
plot = unique(x$plot),
n_trees,
prop_leaf_n = nrow(x[!is.na(x$leaf_n),]) / n_trees
)
}))
Then calculate what percentage of plots have above a minimum
threshold of trees with measurements:
thresh <- 0.8
prop_plots <- sum(prop$prop_leaf_n > thresh) / nrow(prop)
Then I can make an ECDF plot using {ggplot2}:
ggplot() +
geom_line(data = prop,
aes(x = prop_leaf_n, y = 1 - ..y..),
stat = "ecdf", pad = FALSE) +
geom_vline(xintercept = thresh, linetype = 2, colour =
"red") +
geom_hline(yintercept = prop_plots, linetype = 2, colour =
"red") +
labs(x = "Proportion of trees", y = "Proportion of plots")
+
theme_bw()

From the plot above it's easy to see that in 31% of the plots at
least 80% of trees have at least one leaf nitrogen measurement in
the TRY database. It's also easy to see the trend in the coverage.
Hardly any plots have all trees covered by leaf nitrogen
measurements, and it really drops off a cliff at about 98% tree
coverage.
The plot above is generated from a real dataset of ~1250
woodland/savanna plots in southern Africa. It's easy to see that
trait coverage is not great in southern African species, especially
given that leaf nitrogen is one of the most commonly collected
traits that can tell us a lot about life history strategy and place
am individual on the leaf economic spectrum. When you aggregate to
genus coverage gets a bit better, but I am sceptical about how much
I can trust a trait estimate that is an aggregate of species
potentially found across the world. Additionally, these graphs only
tell part of the story, because they only count whether a tree has
at least one trait measurement in TRY. To get decent estimates of
the mean of a trait like leaf nitrogen content you need LOTS of
replication, preferably >10,000 data points to account for all the
bias that can be introduced by site, season, leaf age, tree age,
leaf location on the tree, measurement error, etc.