TITLE: Display line segments with given slope in ggplot2
DATE: 2020-09-05
AUTHOR: John L. Godlee
====================================================================
A question popped up online, where the user wanted to create a plot
identical to this one, in R:

The plot puts GDP per capita against mean life satisfaction, with
an added third variable showing to what extent that mean life
satisfaction is split equally among high and low income people.
Every point has a slope line where the greater the slope, the
higher the disparity in life satisfaction between high and low
income people.
ggplot2 can use geom_abline() to calculate lines with slopes, but
these lines traverse the entire plot, which isn't what we need
here. geom_segment() can be used to calculate line segments, but
only takes line end point coordinates as input. I wrote a simple
function which calculates these end points from a known midpoint
and slope, with some styling to allow for line segments of
different lengths:
library(ggplot2)
dat <- data.frame(x = seq(1,4), y = seq(1,4),
slope = seq(0.5, by = 0.5, length.out = 4))
endPoints <- function(x, y, m, d) {
k <- d / sqrt(1 + (m^2))
xmin <- x - k
xmax <- x + k
ymin <- y - (m * k)
ymax <- y + (m * k)
return(data.frame(xmin, ymin, xmax, ymax))
}
dat_end <- cbind(dat, endPoints(dat$x, dat$y, dat$slope, 0.1))
ggplot() +
geom_point(data = dat_end, aes(x = x, y = y), colour =
"blue") +
geom_segment(data = dat_end, aes(x = xmin, xend = xmax, y =
ymin, yend = ymax))
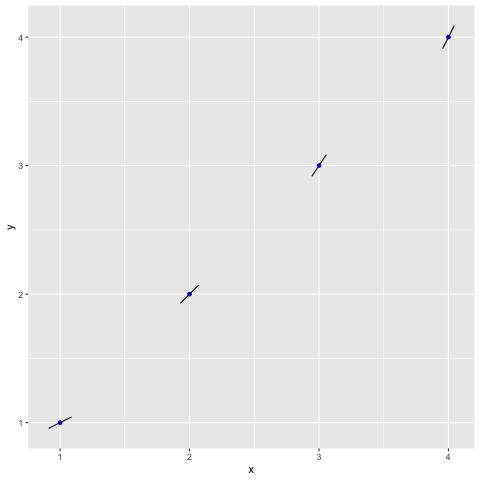
The function basically just re-writes the following equation to
find x and y:
(x \pm \frac{D}{\sqrt{1 + m^2}}, y \pm m \frac{D}{\sqrt{1 +
m^2}})
This produces a plot like this: