TITLE: Flow diagram for data cleaning process
DATE: 2020-06-10
AUTHOR: John L. Godlee
====================================================================
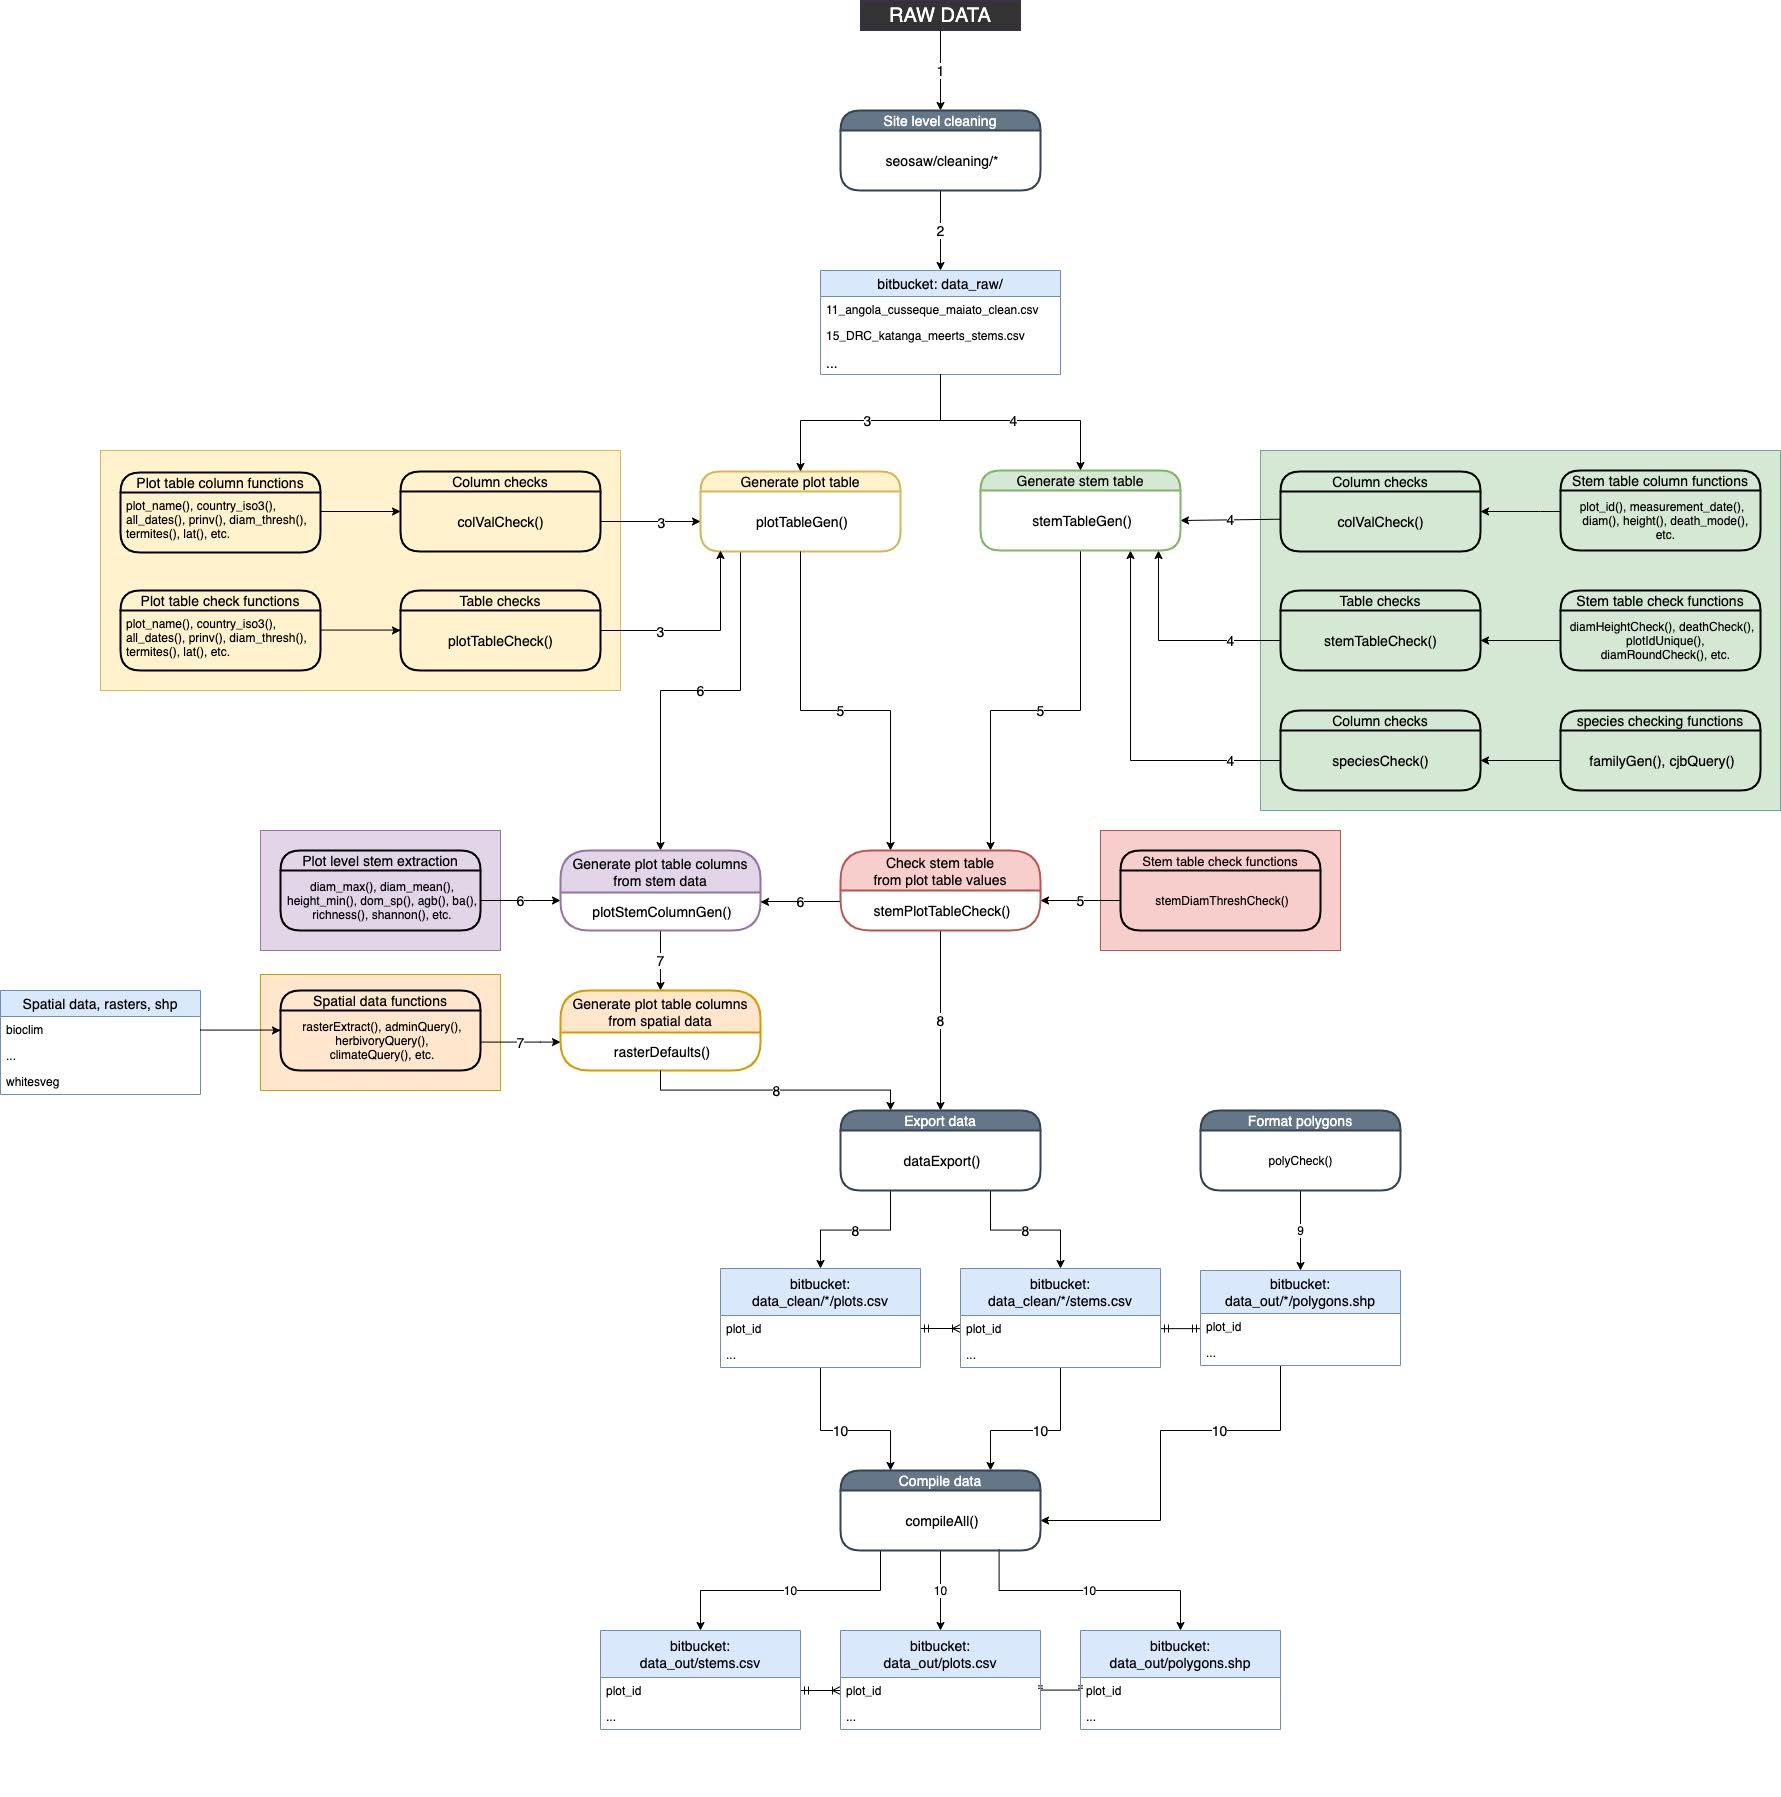
I've been involved in improving the data cleaning process for the
SEOSAW database. I created an R package with a load of data
cleaning functions and designed a workflow for ingesting new data
into the database. Today I faffed around for a while making a flow
diagram to keep track of all the functions.
[SEOSAW]:
https://seosaw.github.io/
I opted for a nested function design. At the bottom end there are
many functions which do very simple things like check whether a
particular column contains the correct factor levels (e.g. diam()).
These functions are the nested within a function which checks all
of the column contents in a dataset which is to be ingested into
the database (e.g. colValCheck()). At the top there are a small
number of high level functions which perform the checking
formatting and adding new columns all in one (e.g. stemTableGen()).
I'm not sure whether this is overly complicated or not, but to me
it seems reasonably intuitive, made easier with some good
documentation. It also affords the user a lot of flexibility in how
they construct their workflow.
The idea is the diagram will be hosted on the SEOSAW website along
with a vignette and the package manual, as well as on the Bitbucket
repository for the SEOSAW dataset, so that users can use it as a
quick reference when cleaning their own data, either for inclusion
into the SEOSAW database, or for comparing their own data with the
SEOSAW repository.