TITLE: Automate CSV typesetting for plot data sheets
DATE: 2020-01-20
AUTHOR: John L. Godlee
====================================================================
I am preparing for fieldwork right now. I'll be measuring trees in
a number of one hectare plots. The trees in these plots have
already been measured in the past so there is a large dataset in
csv format that I can use to help with the remeasurements.
In the past I would have printed this dataset using Excel, which
means playing around with the annoying "Set Print Area" options and
then battling with the Print dialog to get the options I need. This
time I decided to use a combination of R and LaTeX tied together
with a shell script to accomplish the same thing. Although it took
me longer this time, I'll have the same workflow for next time
which should make things a lot quicker in the long term.
I used R to format the data with the columns I wanted and then
export the original dataset as a list of .csv files, one for each
plot.
Then I wrote a template LaTeX file which can be fed a .csv file to
render it as a table which spans multiple pages:
\documentclass[8pt,a4paper]{article}
\usepackage{pgfplotstable}
\usepackage{booktabs}
\usepackage{longtable}
\usepackage{geometry}
\geometry{left=1cm,
right=1cm,
top=1cm,
bottom=1.6cm}
\input{filename_var.tex}
\begin{document}
\centering{\Large{\textbf{\name}}}
\pgfplotstabletypeset[
begin table=\begin{longtable},
end table=\end{longtable},
col sep=comma,
ignore chars={"},
every head row/.style={before row=\toprule,after
row=\endhead\bottomrule},
every last row/.style={after row=\bottomrule},
display columns/0/.style={string type, column
name={\textbf{Plotcode}}},
display columns/1/.style={string type, column
name={\textbf{Plot ID}}},
display columns/2/.style={string type, column
name={\textbf{Stem}}},
display columns/3/.style={string type, column
name={\textbf{Tree}}},
display columns/4/.style={string type, column
name={\textbf{Species}}},
display columns/5/.style={string type, column
name={\textbf{DBH}}},
display columns/6/.style={string type, column
name={\textbf{POM}}},
display columns/7/.style={string type, column
name={\textbf{Alive}}}
]{plot_data_sheets/\file}
\end{document}
The pgfplotstable package allows me to pull in a csv file and
render it as a table. In this case a longtable which can span
multiple pages. I set the format and column name for each column
with the display columns... lines and ensure that the header row
appears at the start of every new page using the every head... and
every last... lines. \input{filename_var.tex} sources a .tex file
which provides the variables \file and \name, which give the full
file name, and the file name without extension for the given .csv
file.
I used a shell script to generate filename_var.tex and run pdflatex
to render a .pdf for each of the .csv files:
#!/bin/sh
for i in plot_data_sheets/*.csv ; do
file=$(basename -- "$i")
name="${file%.*}"
printf '%s\n' "\\newcommand{\\name}{$name}"
"\\newcommand{\\file}{$file}" > filename_var.tex
pdflatex --jobname="plot_data_sheets/$name" table_ex
pdflatex --jobname="plot_data_sheets/$name" table_ex
rm plot_data_sheets/*.aux
rm plot_data_sheets/*.log
done
The .pdf files created at the end look like this:
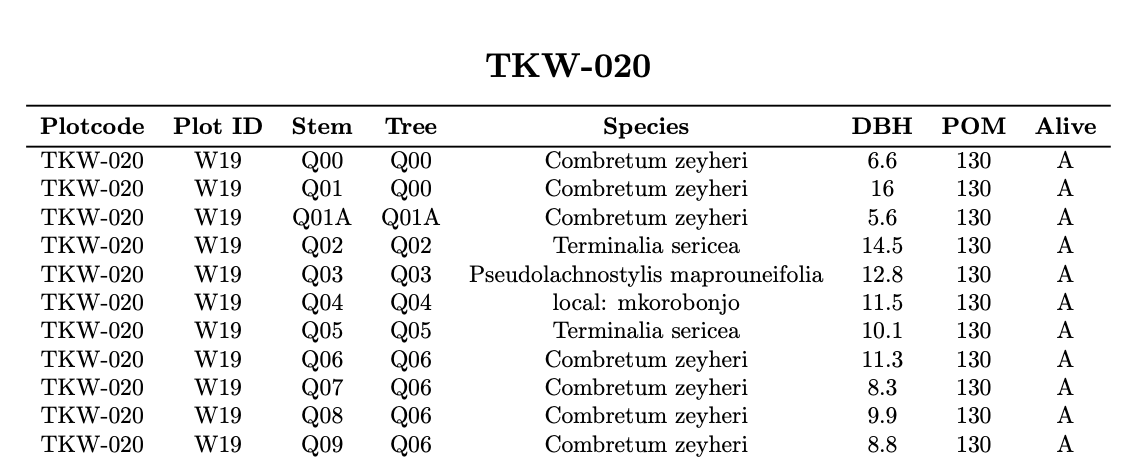
A .pdf version can be downloaded here.
[downloaded
here](
https://johngodlee.xyz/files/latex_csv/render.pdf)