TITLE: Talk at Remote Sensing of Vegetation meeting
DATE: 2019-05-28
AUTHOR: John L. Godlee
====================================================================
I was asked to give a small round up of the research I've been
doing in Angola with a terrestrial laser scanner to try and
quantify relationships between tree species diversity and woodland
canopy architecture. Here is a link to the pdf of the slides, and
below is the script for the talk.
[Here is a link to the pdf of the
slides](
https://johngodlee.xyz/files/veg_remote_talk/presentation.pd
f)
Script
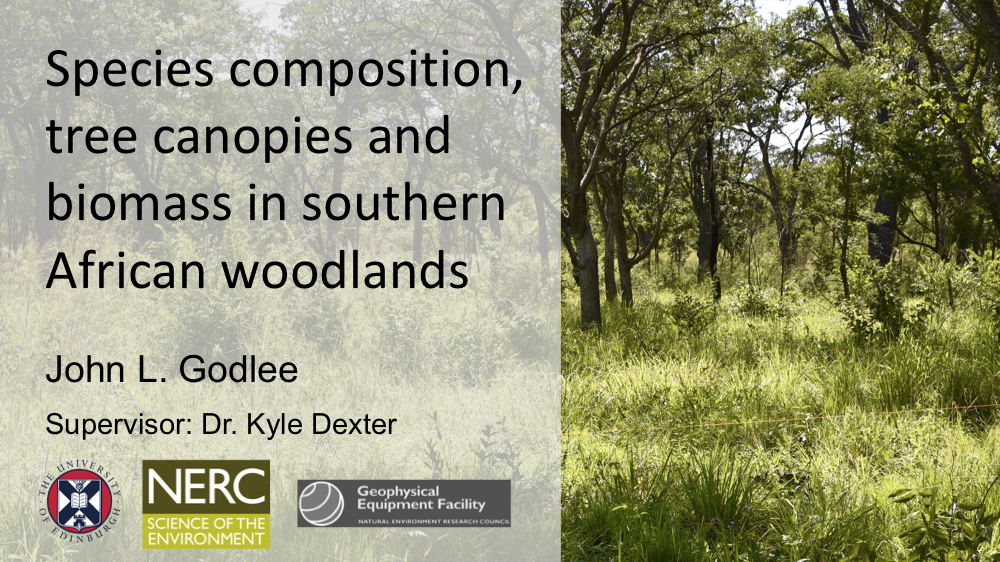
1- I was asked to give a short presentation on what I've been
working on recently for a chapter of my PhD thesis. Broadly,
throughout my whole PhD, I've been looking at possible links
between tree species diversity and woody biomass in southern
African woodlands. For this particular study, I've been
investigating how woodland tree foliage cover and spatial
distribution is affected by tree species composition, and how this
affects woody biomass.
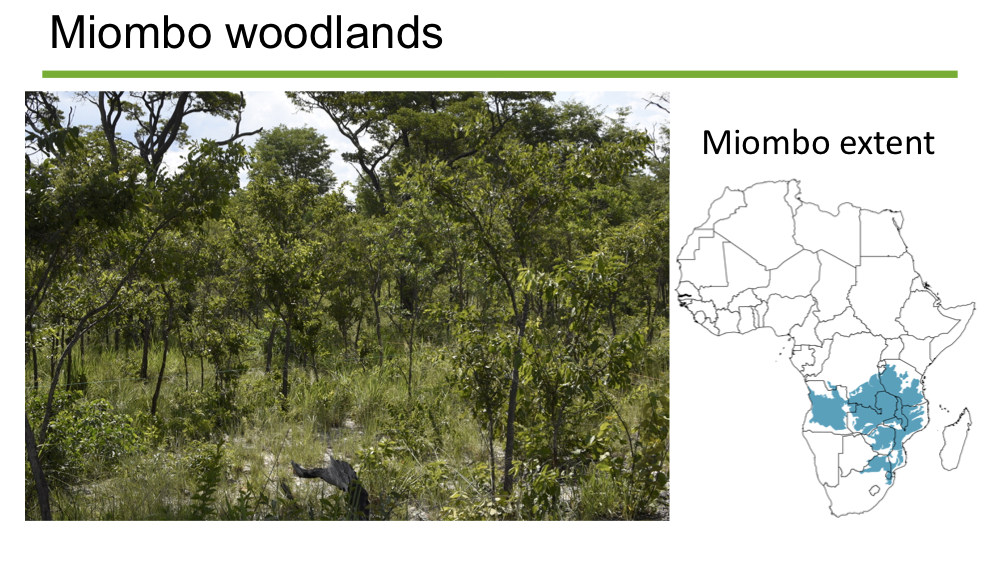
2- Miombo woodlands, where I am focussing my work, are woody
savannahs that span southern Africa and are characterised by an
often thick grassy understorey and relatively species poor canopy
tree layer that can vary in canopy cover. Miombo woodlands are
structured by seasonal fires which occassionally track up into the
tree canopy, leading to an abundance of multistemmed small trees
from repeated regrowth after fire.
3- I'm approaching my PhD from the standpoint of the
Biodiversity-Ecosystem Function Relationship, which postulates that
at a local scale, as you increase the number of species present in
an ecosystem, the values of various rate ecosystem processes and
properties also increase, these processes and properties are known
as ecosystem functions. Gross primary productivity is the most
widely studied ecosystem function, but the definition can be
extended to things like soil water or nutrient retention, or to
things like the resilience of productivity to disturbance. The idea
of a universal Biodiversity Ecosystem Function Relationship is
still a contentious subject, but an attractive hypothesis, as it
helps to further justify biodiversity conservation. More likely is
that the Biodiversity Function Relationship varies hugely among
ecosystems, according to the ecosystem functions being studied, and
according to other environmental drivers which affect resource
availability and the degree of disturbance in an ecosystem.

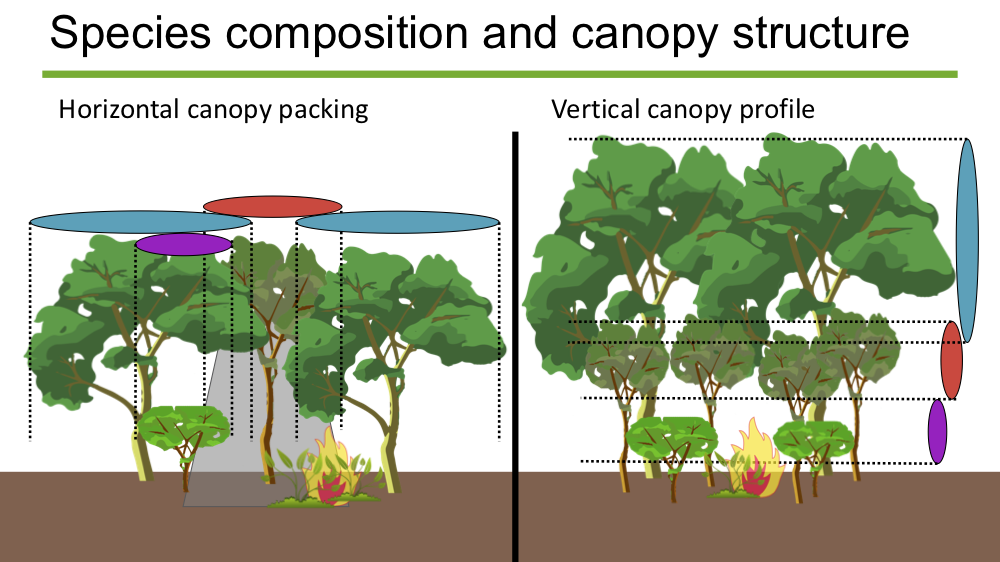
4- For this study, I wanted to look at how species composition of
trees in miombo woodlands corresponded with the tree canopy
architecture, spatial structure, and woody biomass of those
woodlands. Tree species vary in the different niches they fill
within a woodland, adopting different growth strategies to overcome
competition and disturbances. Some tree species might be better
able to escape the flammable zone near to the ground to become
large emergent trees while others may instead rely on extensive
root systems to allow regrowth after seasonal burning, leading to a
prolonged existence as a multi-stemmed bush-like understorey tree.
Similarly, some canopy tree species may be more tolerant of low
light environments during growth allowing them to grow under the
canopy of overhanging large trees. With all these different growth
strategies, having more tree species in a given area could result
in a higher stem density and overall foliage cover, leading to
greater woody biomass. Traditionally, measuring things like canopy
structure would require lots of tape measures and long sticks to
map tree dimensions, but this is incredibly time consuming and
unless a great deal of care is taken when measuring, the data can
be pretty inaccurate so I decided to employ the use of a
terrestrial laser scanner to help me automate that data collection,
which I'll get onto in a little bit.
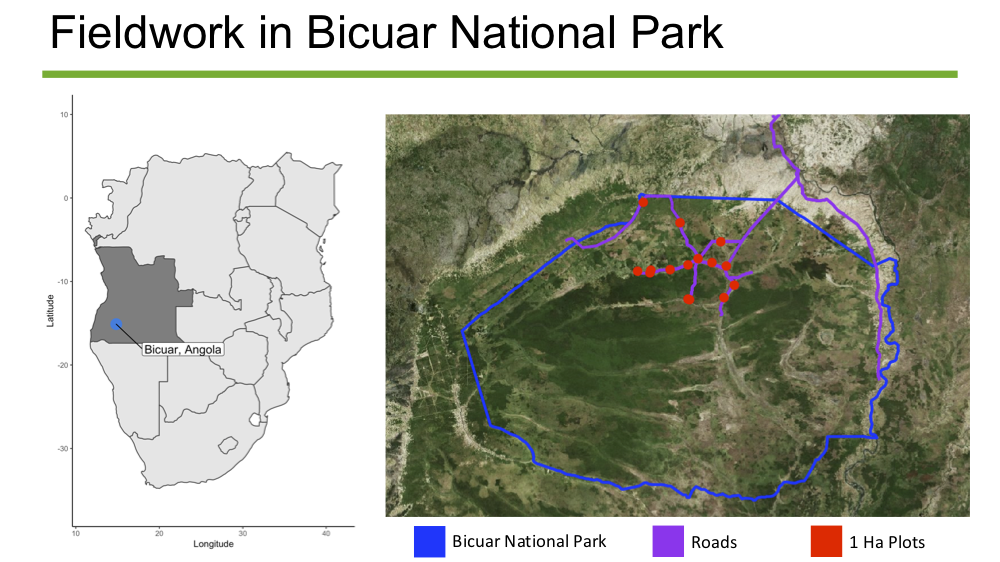
5- I conducted my fieldwork inside Bicuar National Park in
southwest Angola. The park is about 8000 km^2, and represents one
of the best preserved contiguous areas of miombo in the region,
with much of the surroundings having been transformed to grazing
and arable land. With a team from the Instituto de Ciencias de
Educacao, based in Lubango about 120 km away from the park, we
created 15 1 Ha square survey plots within which I conducted
measurements to answer this question.
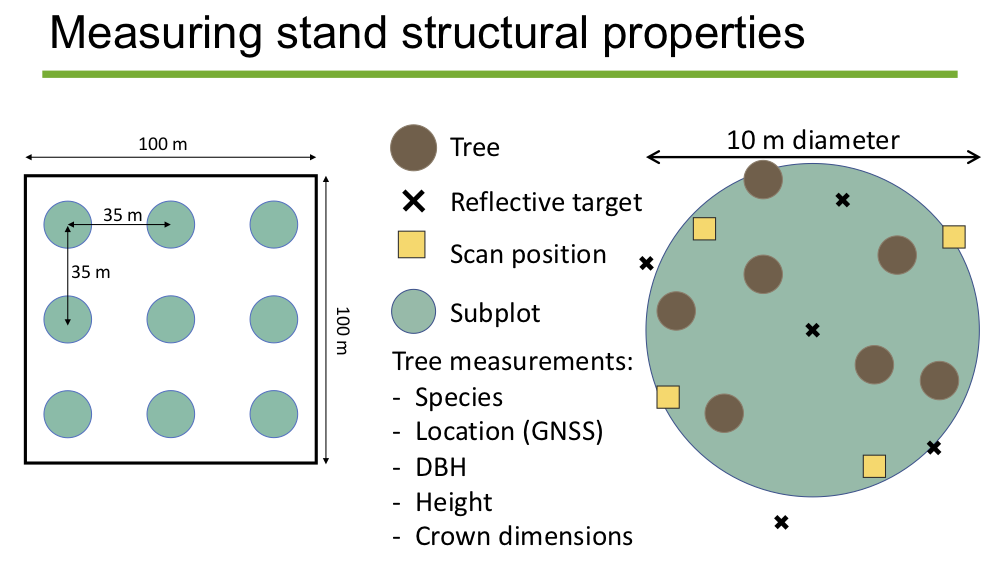
6- I further subdivided these 1 Ha plots into a grid of nine 10 m
diameter circular subplots which represent the sample unit for my
study. In each of these subplots I measured every tree that had
branch material inside the subplot, I measured the trunk diameter
and height, the species and the precise location using GNSS
equipment with a rover and base station used in a post processing
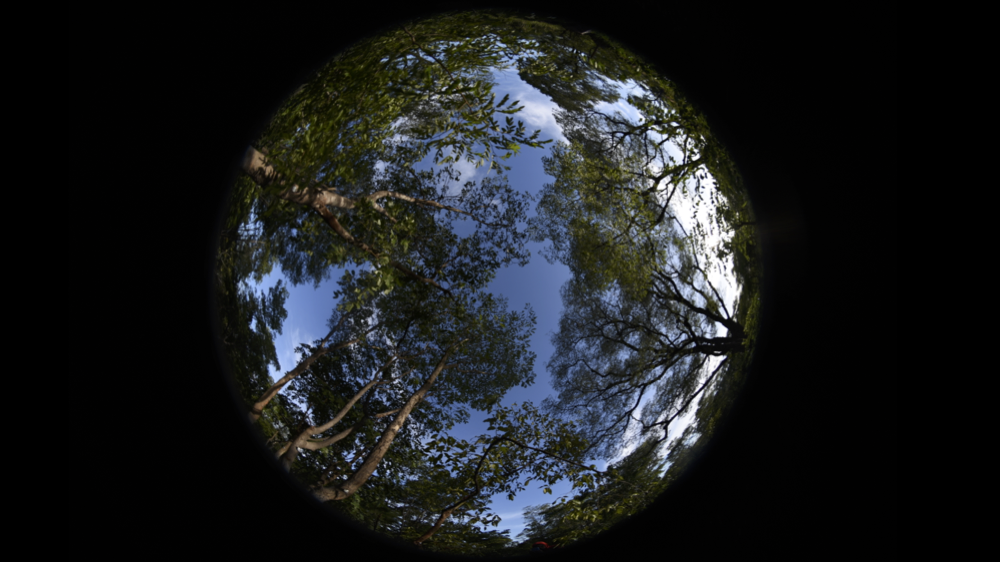
kinematic setup. I used a phase shift terrestrial laser scanner to
create a 3D point cloud of the tree foliage material inside each
subplot, with the laser scanner positioned in multiple locations to
allow me to eliminate potential shadows caused by the trees
themselves. I used reflective targets which were also geo-referencd
with the GNSS equipment to allow me to stitch the images together
later. The point clouds can then be used to quantify the spatial
structure of the tree canopy foliage in the different subplots.
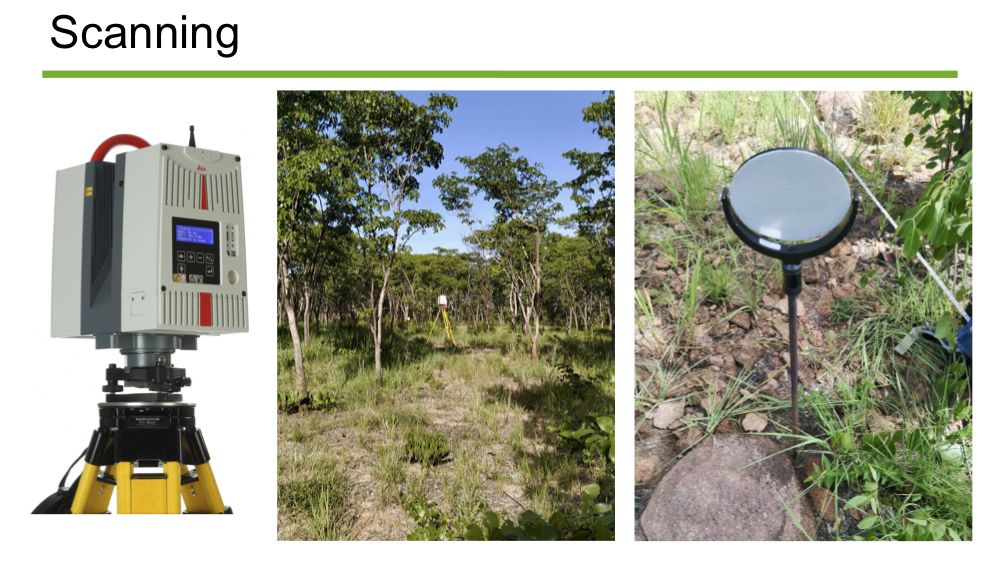
7- This is the laser scanner, a Leica HDS6100, which sits on a
tripod and records a nearly spherical point cloud in 360 degrees.
These are the reflective targets screwed onto threaded bar which
was then hammered into the ground.
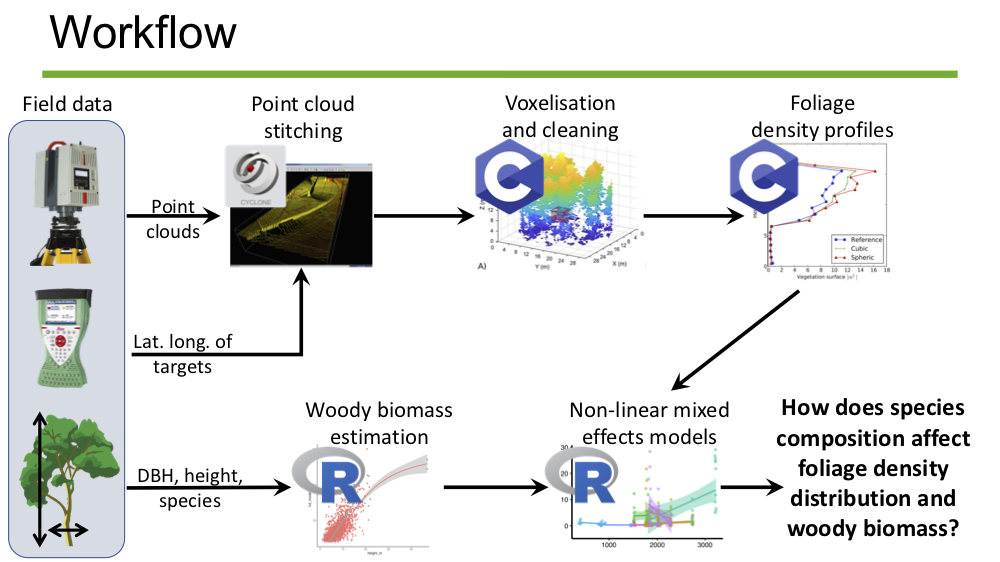
8- So now that I have all the scans and the fieldwork is mostly
finished, the next step is to process them, which first involves
taking the raw point cloud files from the scanner and stitching
them together using Leica's proprietary Cyclone software to
eliminate shadows, then recentering the resulting point cloud on
the centre of the circular subplot, and exporting that as a .ptx
for each subplot, which show the coordinates in real space of each
laser 'hit' on an object like a leaf or a tree trunk. With the help
of some C code that a colleague wrote and has been kind enough to
help me understand up to now, I should be able to generate foliage
density profiles for each subplot, which show the distribution of
tree foliage in the vertical plane across the subplot. I can then
statistically analyse those foliage density profiles, taking into
account my other measurements of biomass and species composition to
test hypotheses of whether tree species composition does indeed
affect the vertical distribution of leaf area in a subplot, and
whether that is a mechanism by which plot level woody biomass is
increased or decreased. I should be able to use the same point
cloud data to look at horizontal aggregation of foliage as a
function of species diversity and there is even the possibility
that in the future I could use some other methods to extract
individual tree canopies from the point cloud and analyse how
individual tree growth forms vary across different woodland species
communities. I only got back into normal work mode a couple of
weeks back so at the moment I'm just working on getting all the
data cleaned up and stitching the point clouds together. As always
there are problems with some of the data, either because I didn't
properly exclude shadows or the GNSS locations aren't accurate
enough, so I'm thankful I built plenty of replication into the
study design, having nine subplots per 1 Ha plot.
9- I should say that the NERC Geophysical Equipment Facility
provided all the laser scanning and GPS equipment that I used and
they were super helpful in all sorts of ways while I had the
equipment on loan.