TITLE: Making inset maps for publication
DATE: 2019-02-20
AUTHOR: John L. Godlee
====================================================================
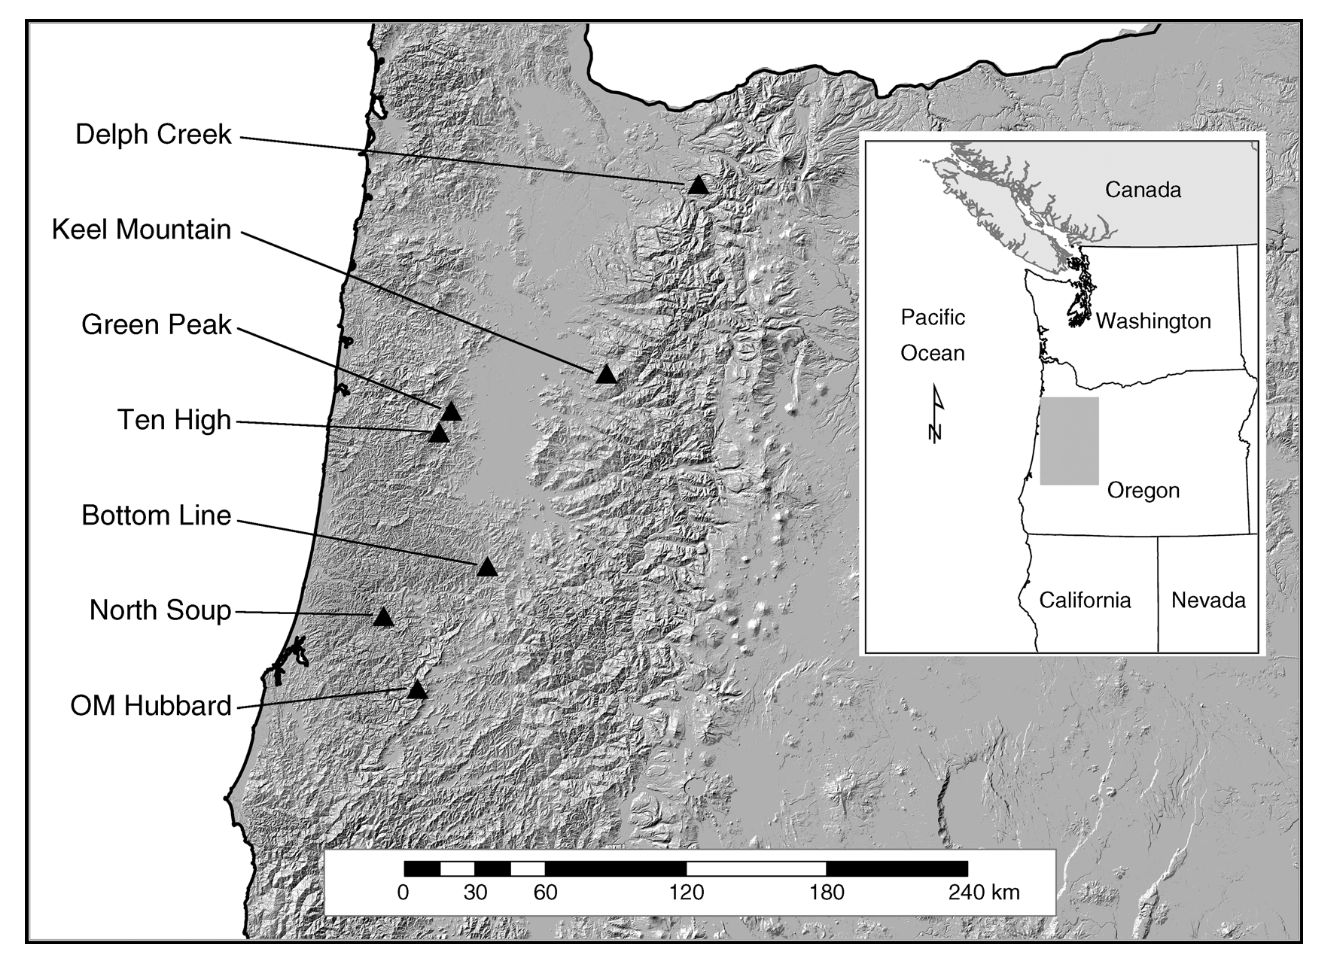
In scientific publications, often there is a map to describe the
study location. For example in Burton et al. (2013), which is the
first publication I found with an inset map by searching for the
key word "inset map".
I wanted to be able to make these maps directly in R, rather than
manually exporting each map image and overlaying them in PowerPoint
or Photoshop. The maps I make are in {ggplot2}, so the examples
here all use ggplot2. The example involves making a map of Angola
and adding some points of key cities, then adding an inset map
showing the location of Angola in the world.
First, load some packages:
library(ggplot2)
library(rworldmap)
Then create fortified polygons by grabbing country data from
{rworldmap}, using the getMap() function:
world <- getMap(resolution = "low")
world_f <- fortify(world)
angola <- world[world@data$ADMIN == "Angola", ]
angola_f <- fortify(angola)
Then, make the inset world map, by wrapping the normal ggplot()
call in ggplotGrob():
world_grob <- ggplotGrob(
ggplot() +
geom_polygon(data = world_f, aes(x = long, y = lat, group =
group), fill = NA, colour = "black") +
geom_polygon(data = angola_f, aes(x = long, y = lat), fill
= "#F2C81F") +
theme_void() +
coord_quickmap() +
theme(panel.background = element_rect(fill = "white",
colour = "black"))
)
This saves the ggplot object in a format that can be added later as
an annotation_custom().
Then, create some city location data:
city_location <- data.frame(city = c("Luanda", "Lubango"),
long = c(13.267, 13.500),
lat = c(-8.845, -14.918))
Then create a ggplot() object of the country of Angola, with the
city locations added as geom_point():
angola_ggplot <- ggplot() +
geom_polygon(data = angola_f, aes(x = long, y = lat),
fill = "#F2C81F", colour = "black") +
geom_point(data = city_location, aes(x = long, y = lat),
colour = "black", size = 5) +
geom_label(data = city_location, aes(x = long, y = lat,
label = city), hjust = -0.2) +
theme_classic() +
coord_quickmap() +
labs(x = "Longitude", y = "Latitude")
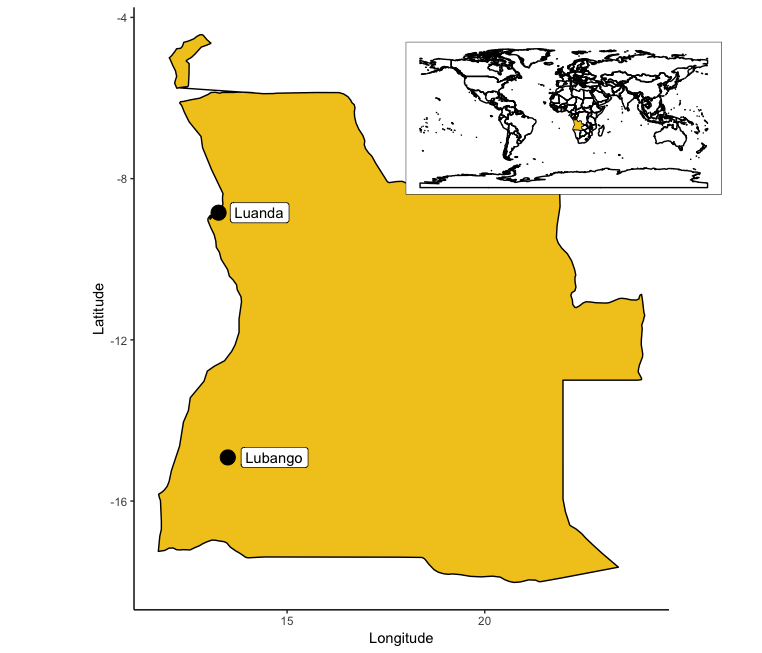
Finally, plot angola_ggplot again, using annotation_custom() to add
the world_grob:
angola_ggplot +
annotation_custom(grob = world_grob,
xmin = 18, xmax = 26,
ymin = -9, ymax = -4)
annotation_custom() allows you to set the x and y location of the
grob, using the coordinate system on the base plot, which in this
case is decimal latitude and longitude.