TITLE: Calculating NDVI from Sentinel 2 images for Bicuar National
Park
DATE: 2018-11-20
AUTHOR: John L. Godlee
====================================================================
I recently ventured into trying to make sense of sentinel 2 data,
multispectral remote sensing imagery. I wanted to calculate NDVI
for Bicuar National Park, so I could see whether it's possible to
identify areas of miombo woodland within the park using variation
in the NDVI, which you would expect is higher in woodland and lower
in grassland.
I got some cloud free images for the area covering Bicuar and wrote
a Python script which calculates NDVI, from the red band and near
infra-red band:
# Import libraries
import glob
import gdal
import os
import fnmatch
import re
import cv2
# Define a function to find files given a pattern
def find(pattern, path):
result = []
for root, dirs, files in os.walk(path):
for name in files:
if fnmatch.fnmatch(name, pattern):
result.append(os.path.join(root, name))
return result
# Set working directory for images
rootdir = '/sentinel_bicuar'
os.chdir(rootdir)
# Create a list of folders
folders = next(os.walk(os.getcwd()))[1]
# Loop through each folder in turn
for i in folders:
# Set input directory
in_dir = rootdir + '/' + i
# Search directory for desired bands
red_file = find('*B04.jp2', in_dir)[0]
print("Processing: " + red_file)
nir_file = find('*B08.jp2', in_dir)[0]
# Open each band using gdal
red_link = gdal.Open(red_file)
nir_link = gdal.Open(nir_file)
# Store as an array
red_array = red_link.GetRasterBand(1).ReadAsArray() * 0.0001
nir_array = nir_link.GetRasterBand(1).ReadAsArray() * 0.0001
# Create a mask filled with zeroes
mask = red_array == 0.
# Calculate NDVI
ndvi2 = (nir_array - red_array) / (nir_array + red_array)
# Set mask values back to 0
ndvi2[mask] = 0.
# Create output filename based on input name
out_string_a = re.search('A004323_(.*)/IMG_DATA',
red_file).group(1)
out_string_b = re.search('IMG_DATA/(.*)_B04.',
red_file).group(1)
out_file = rootdir + '/' + out_string_a + '_' + out_string_b
+ '_NDVI.tif'
print('Creating file: ' + out_file)
# Get dimensions
x_pixels = ndvi2.shape[0] # number of pixels in x
y_pixels = ndvi2.shape[1] # number of pixels in y
# Set up output GeoTIFF
driver = gdal.GetDriverByName('GTiff')
# Create driver using output filename, x and y pixels, # of
bands, and datatype
ndvi_data = driver.Create(out_file,x_pixels, y_pixels, 1,
gdal.GDT_Float32)
# Set nodata value
ndvi_data.GetRasterBand(1).SetNoDataValue(0.)
# Set NDVI array as the 1 output raster band
ndvi_data.GetRasterBand(1).WriteArray(ndvi2)
# Setting up the coordinate reference system of the output
GeoTIFF
geotrans=red_link.GetGeoTransform() # Grab input GeoTranform
information
print(geotrans)
proj=red_link.GetProjection() # Grab projection information
from input file
# now set GeoTransform parameters and projection on the
output file
ndvi_data.SetGeoTransform(geotrans)
ndvi_data.SetProjection(proj)
ndvi_data.FlushCache()
ndvi_data=None
print("DONE")
Then I use gdal to merge each of the resultant .tif files with an
NDVI band into a single file, then clip that file with the outline
of Bicuar National Park.
[Bicuar National Park]:
https://www.protectedplanet.net/#thematic-areas
#!/bin/bash
echo "Merging tif files"
gdal_merge.py -n 0 -a_nodata 0 *_NDVI.tif -o ndvi_merge_o.tif
gdalwrap -t_srs '+proj=longlat +datum=WGS84' ndvi_merge_0.tif
ndvi_merge_0_longlat.tif
gdalwarp -cutline
'bicuar_shp/WDPA_Mar2018_protected_area_350-shapefile-polygons.shp'
-crop_to_cutline -dstalpha ndvi_merge_0_longlat.tif
ndvi_merge_0_longlat_bicuar.tif
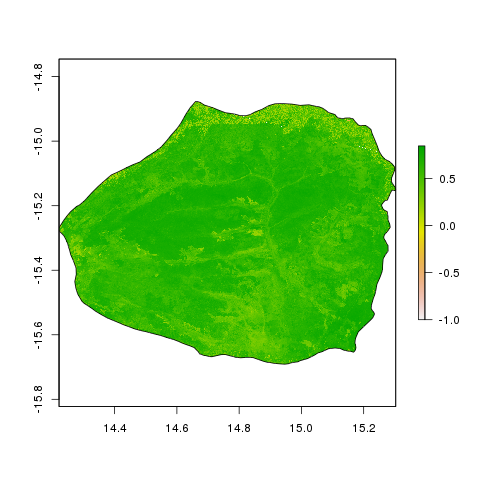
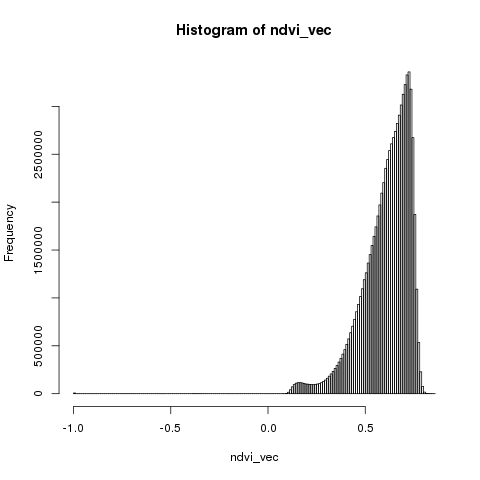
Then I can use an R script to look at the distribution of NDVI
across the park
# Packages
library(raster)
library(rgdal)
# Import data ----
ndvi_tif_bicuar <- raster("ndvi_merge_0_longlat_bicuar.tif")
ndvi_vec <- getValues(ndvi_tif_bicuar)
hist(ndvi_vec, breaks = 100)
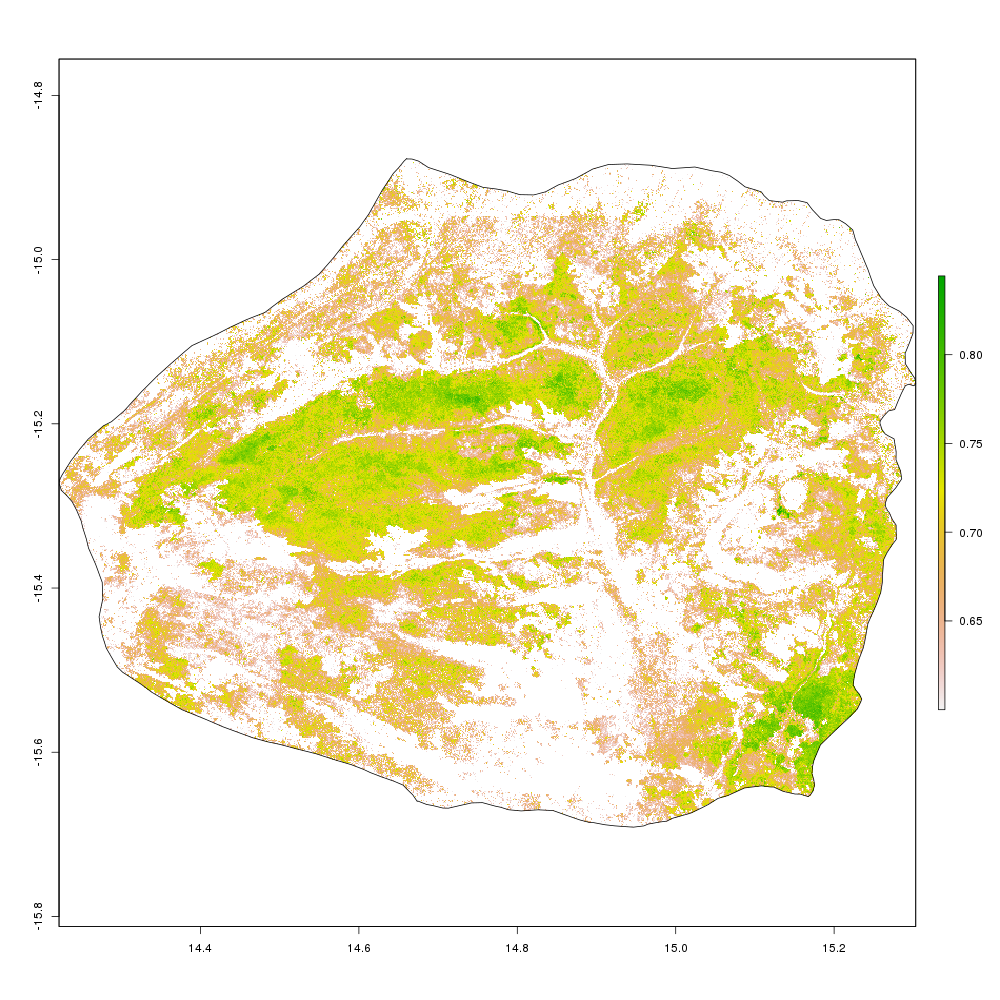
I can also experiment with plotting areas of the park within a
certain threshold of NDVI
ndvi_thresh <- ndvi_tif_bicuar[ndvi_tif_bicuar < 0.6] <- NA
plot(ndvi_thresh)