TITLE: Spoon carving trees in the SEOSAW network
DATE: 2018-08-20
AUTHOR: John L. Godlee
====================================================================
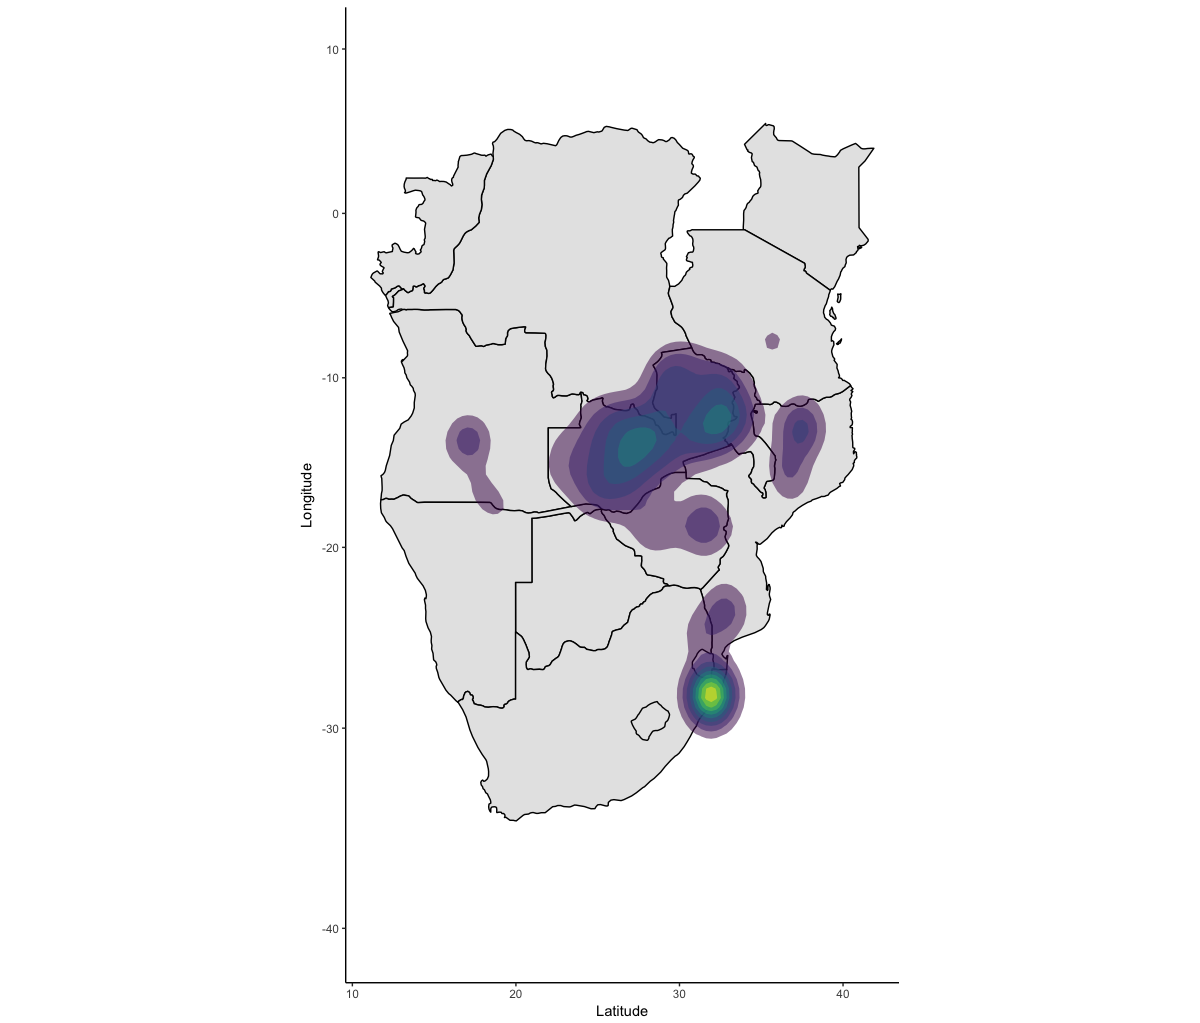
For a project I've been helping out with, I had to find information
on the human uses of tree species in African savannas. I used the
book "Field Guide to Trees of Southern Africa" by Wyk and Wyk
(2013), which has lots of information in the text descriptions of
each species. Of the 645 species in our plots, 346 had information
on human uses in the book. While we were looking specifically at
edible fruits and timber uses, there was information on a load of
other things, such as religious and magical uses, medicinal uses
etc. Included in this was information about which species were
useful for making household utensils and spoons. I like to carve
spoons so I thought I'd have a go at mapping out the locations of
trees in the SEOSAW network that can be used for making spoons,
this is the R code:
[Field Guide to Trees of Southern Africa]:
https://www.amazon.com/Field-Southern-Africa-Struik-Publishers-ebook
/dp/B00EDLEUDA
# Packages
library(ggplot2)
library(dplyr)
library(tibble)
library(maps)
library(viridis)
# Load data ----
species <- read.csv("data/seosaw_species_wyk_wyk.csv")
load("data/community_matrices.Rdata") # comm
load("data/seosaw_plot_summary6Jul_v3.Rdata") # ssaw6
# Filter data ----
# Remove rows with no entry in wyk & wyk, and no entry in notes
species_fil <- species %>%
filter(in_wyk_wyk == TRUE) %>%
filter(!is.na(notes_transcript))
# Extract longitude and latitude of plots
plot_loc <- data.frame(ssaw6$plotInfoFull$longitude_of_centre,
ssaw6$plotInfoFull$latitude_of_centre,
as.character(ssaw6$plotInfoFull$plotcode))
names(plot_loc) <- c("lon", "lat", "plotcode")
# Extract species abundance matrix ----
sp_mat <- comm$sp
# Find species with mention of key phrases ----
matches <- c("household utensils",
"kitchen utensils",
"implement handles",
"agricultural implements",
"walking sticks",
"household items",
"axe handles",
"spoons")
match_regex <- paste(matches,collapse="|")
species_spoons <- species[grep(match_regex,
species$notes_transcript),]
species_spoons$species
length(species_spoons$species)
# Find out which plots contain those species ----
plot_spoons <- sp_mat %>%
select(one_of(as.character(species_spoons$species))) %>%
rowSums() %>%
as.data.frame() %>%
tibble::rownames_to_column() %>%
rename(plotcode = rowname) %>%
filter(. > 0)
# Match plot locations in `plot_loc` to plots with spoony trees
`plot_spoons$plot` ----
plot_spoon_loc <- right_join(plot_loc, plot_spoons, by =
"plotcode")
names(plot_spoon_loc) <- c("lon", "lat", "plotcode", "stems")
# Map the plots ----
# Create vector of southern Africa ISO codes - find a way
to mine the data for this
s_af <- iso.expand(c("ZAF", "COD", "NAM", "ZMB", "BWA", "ZWE",
"MOZ", "MWI", "AGO", "TZA", "KEN", "COG"))
# Create map of country outlines
map_africa <- borders(database = "world", regions = s_af, fill
= "grey90", colour = "black")
ggplot(plot_spoon_loc, aes(x = lon, y = lat)) +
map_africa +
stat_density2d(aes(fill = ..level..), geom = "polygon",
alpha = 0.5) +
scale_fill_viridis() +
# geom_point(size = 0.2) +
theme_classic() +
coord_map() +
ylim(-40,10) +
theme(legend.position = "none") +
labs(x = "Latitude",
y = "Longitude")