TITLE: Mapping GPX tracks from AAT for Android, in R
DATE: 2018-04-28
AUTHOR: John L. Godlee
====================================================================
I stopped using Strava to track my cycle rides, because I didn't
feel comfortable giving away all that GPS data to a third party. I
know lots of other things I do give away my location, but this is a
small step in the right direction. It also prompted me to play with
new GPS tracking apps.
The one I have settled on is called AAT, which is a lovely
brutalist piece of open source software that is designed around
tracking cycling.
[AAT]:
https://f-droid.org/en/packages/ch.bailu.aat/
It stores tracks as GPX files, which can then be manipulated and
plotted in other softwares. In this case, I wanted to use R. The
script is below and here and an example GPX file from AAT can be
found here.
[here](
https://johngodlee.xyz/files/gpx/import_gpx_tracks.R)
[1](
https://johngodlee.xyz/files/gpx/2018_04_19_0.gpx)
Note that you may have to install ggmap from the github repository
like this: devtools::install_github("dkahle/ggmap"), as the CRAN
mirror is often way behind.
# Packages ----
library(rgdal) # readOGR(), ogrListLayers()
library(ggplot2) # ggplot()
library(ggmap) # get_map(), ggmap()
# setwd ----
setwd("~/tracks")
# Import file ----
# Find out what layers are in the file
(layers <- ogrListLayers("2018_04_19_0.gpx"))
# Import the points layer, which contains elevation data
track_points <- readOGR("2018_04_19_0.gpx", layer = layers[5])
# Import the tracks layer as a spatiallinesdataframe
# Test plot
plot(track_points)
# Transform data to data frame for plotting ----
# Create data frame from spatial object
track_df <- data.frame(track_points@coords,
track_points$ele,
track_points$time,
track_points$track_seg_point_id)
# Rename columns
names(track_df) <- c("lon", "lat", "elev", "time", "seg_id")
# Convert time to posixCT
track_df$time_posix <- track_df$time %>%
as.POSIXct(., format = "%Y/%m/%d %H:%M:%S ")
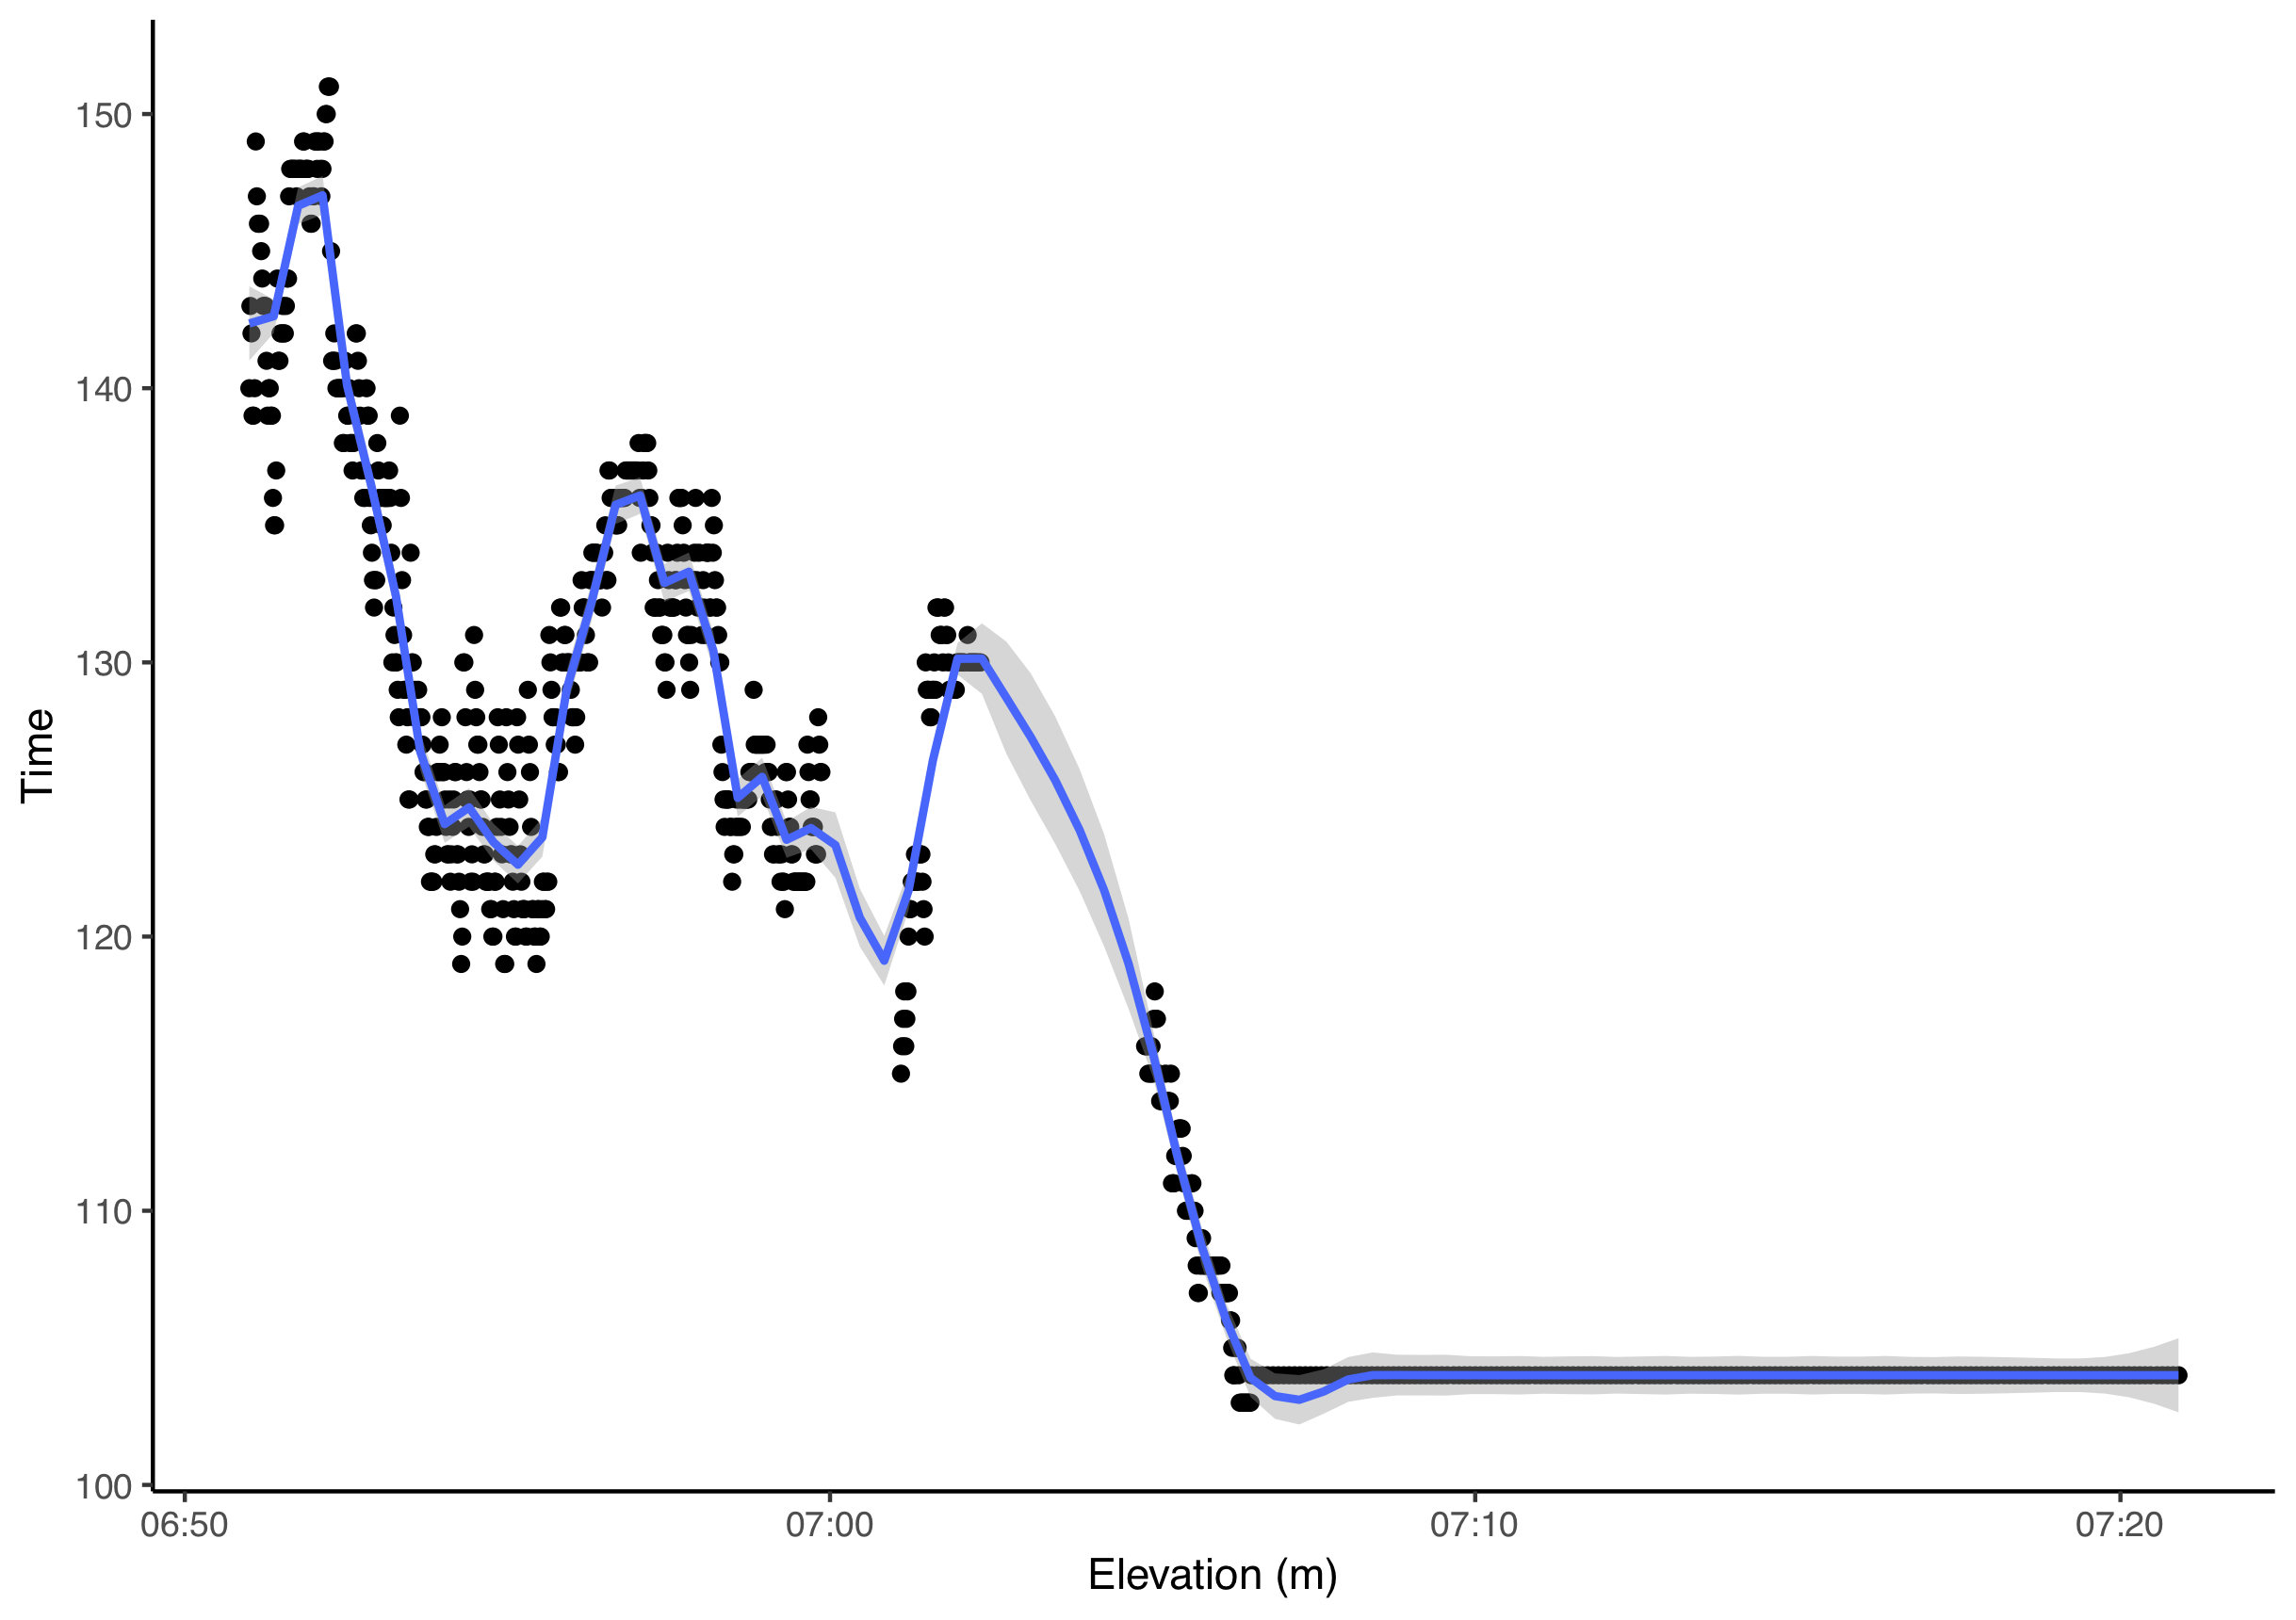
# Create plots ----
# Create elevation plot
(elev_plot <- ggplot(track_df, aes(x = time_posix, y = elev)) +
geom_point() +
geom_smooth(method = "loess", span = 0.1) +
scale_x_datetime() +
theme_classic() +
xlab("Elevation (m)") +
ylab("Time"))
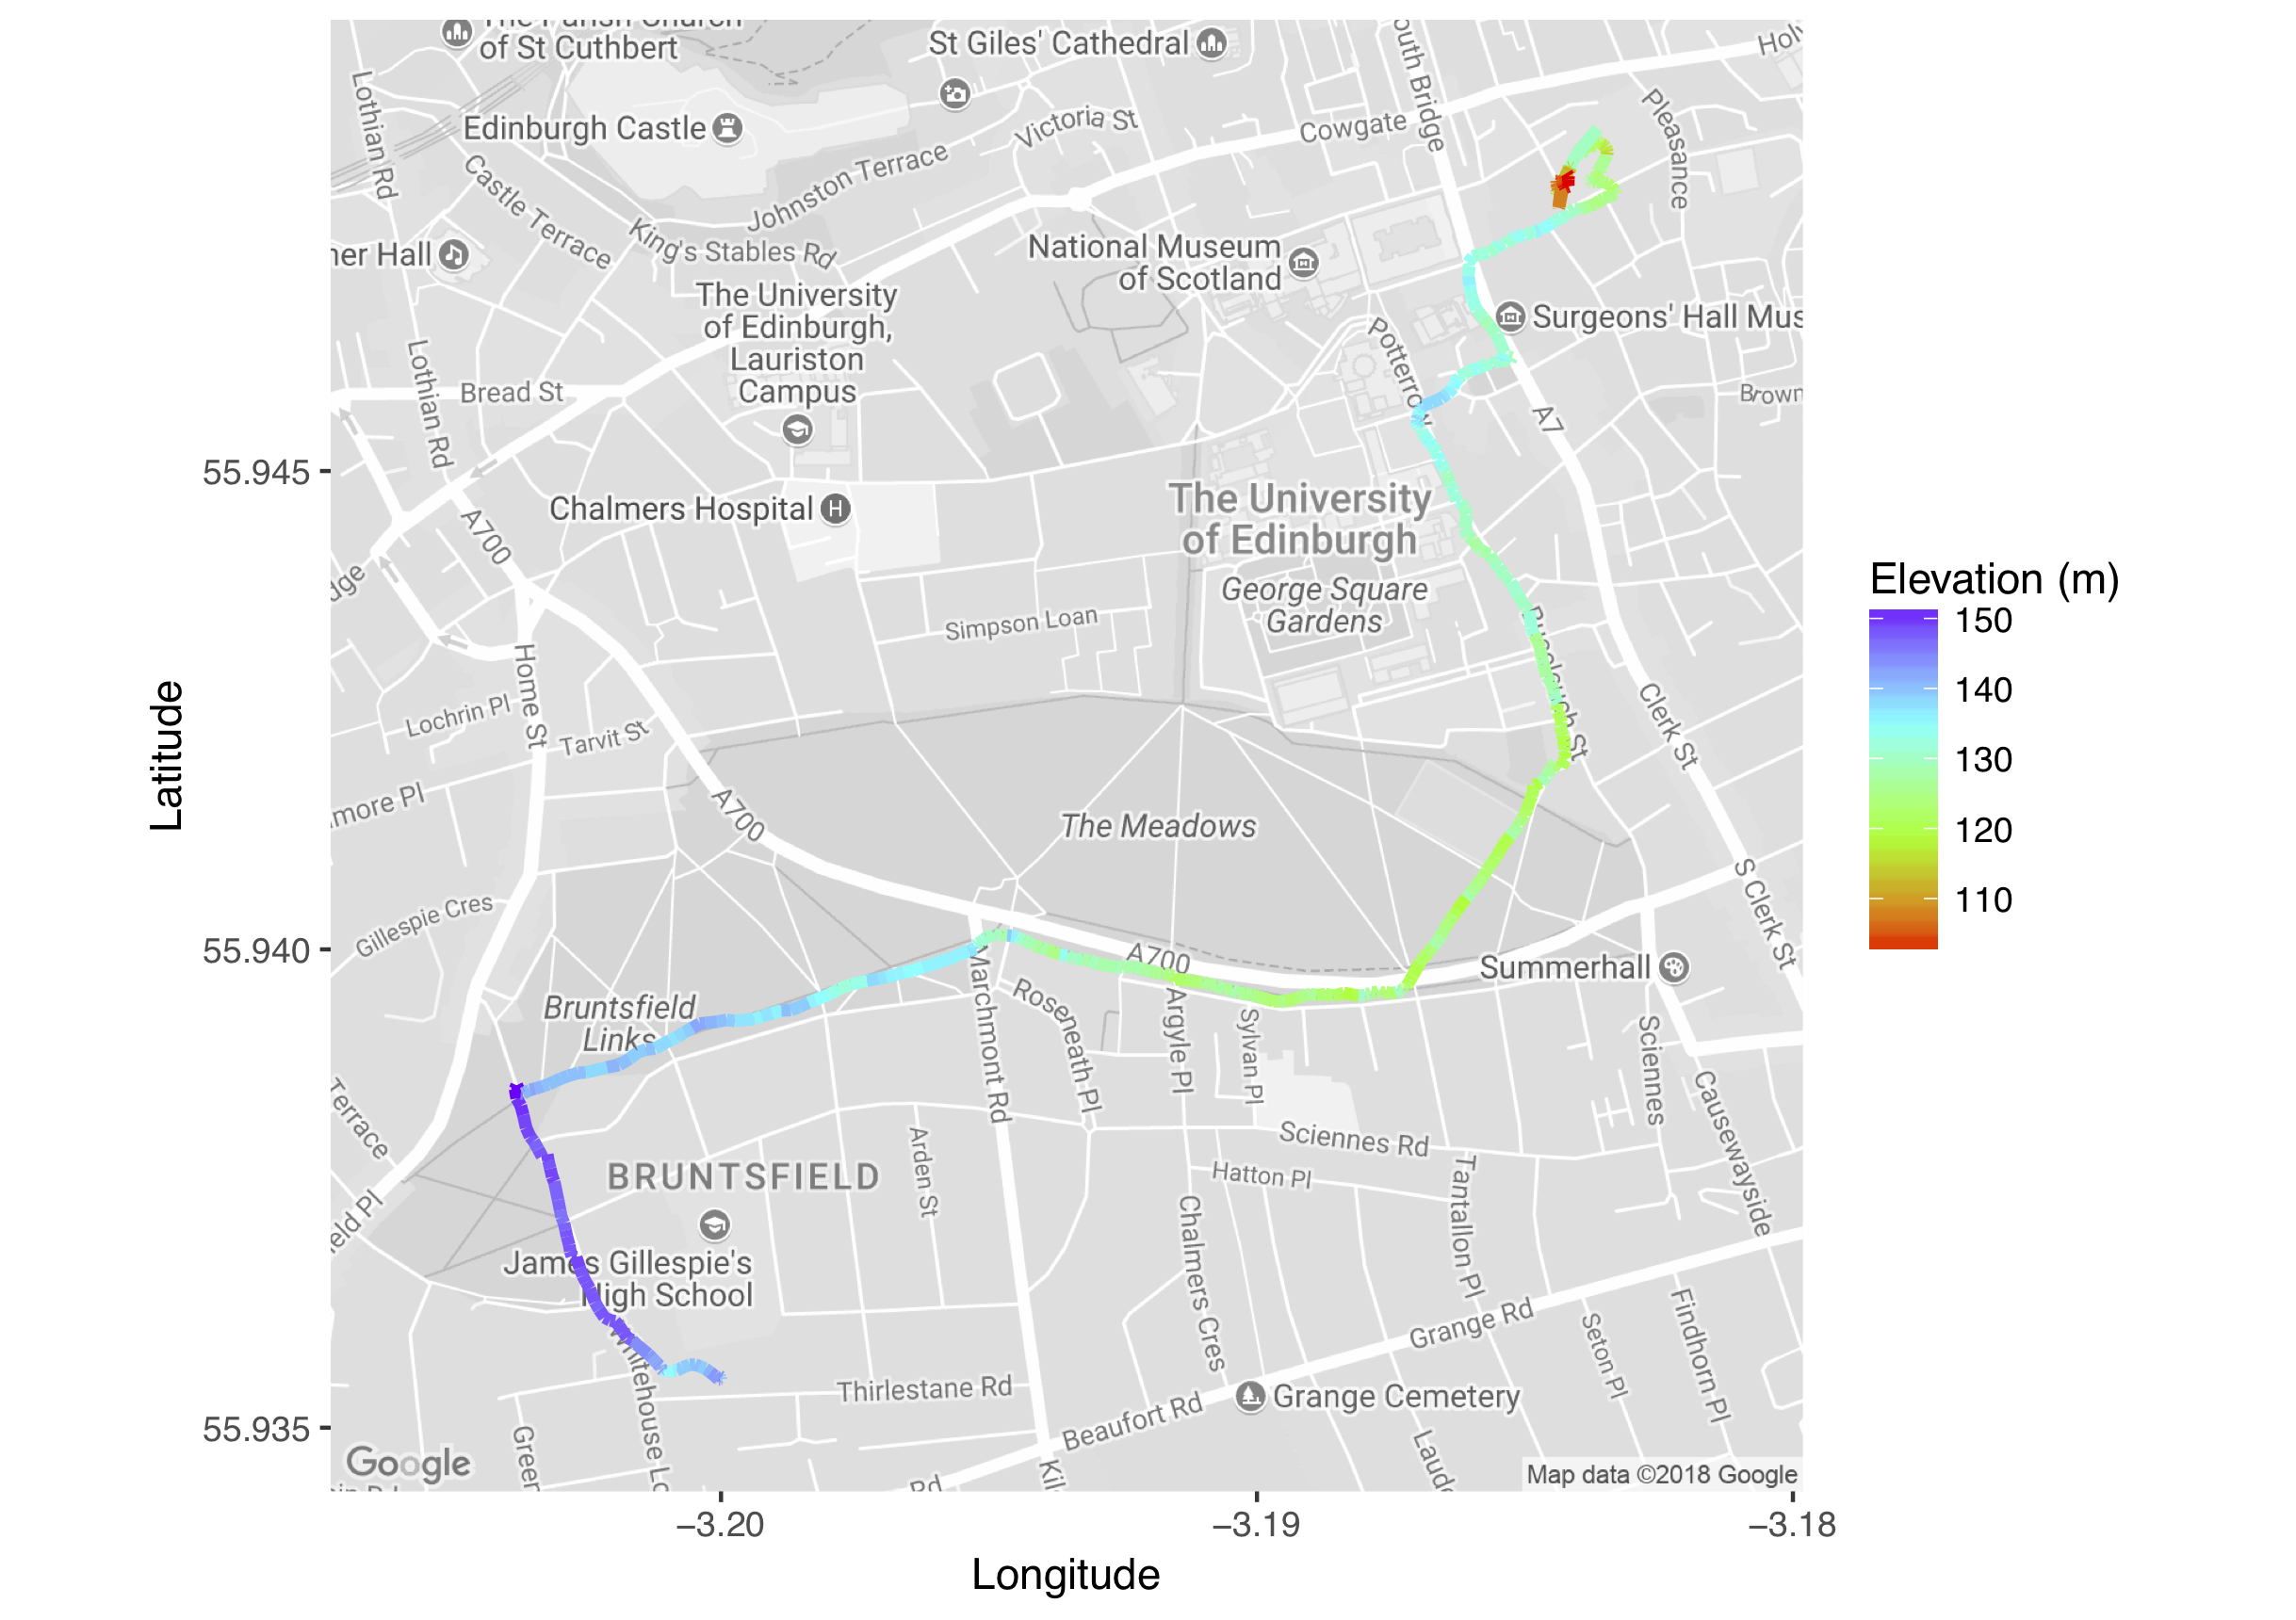
# Plot map using ggmap
goog_map <- get_map(location = track_points@bbox,
zoom = 15,
maptype = "roadmap", color = "bw")
(route_map <- ggmap(goog_map) +
geom_path(data = track_df,
aes(colour = elev), size = 1.5) +
scale_color_gradientn(colours = rainbow(4)) +
guides(colour = guide_colourbar(title="Elevation (m)")) +
xlab("Longitude") +
ylab("Latitude"))
The script outputs an elevation plot and a map which shows the
track, coloured by elevation.