TITLE: Elephants affect the spatial distribution of savannah trees
DATE: 2017-12-01
AUTHOR: John L. Godlee
====================================================================
I have been attempting to write some scripts that will hopefully
serve me well as I progress through writing my PhD. As I'm looking
at the spatial distribution of trees and their canopy properties in
dry tropical woodlands/savannahs, I thought it would be good to
learn how to effectively plot tree distributions in plots. So I got
hold of some data which contains the lat-long coordinates of trees
in two 25 ha permanent savannah plots, one of which is known to be
home to elephants, and one which isn't. As always, the code I used
is in R.
The data and an example script which I used can be found here.
[here](
https://johngodlee.xyz/files/elephants/elephant_data.zip)
First load the necessary packages:
# Packages ----
library(ggplot2) # Plotting
library(dplyr) # Manipulating data
library(readr) # Importing data
library(viridis) # Colour schemes
Then load in the data:
# Set working directory ----
setwd(dirname(rstudioapi::getActiveDocumentContext()$path))
# Import data ----
# Tree locations and diameters
tree_loc_diam_1_2_summ <- read.csv("tree_loc_diam_1_2.csv")
# Plot bounding boxes
plot_bbox_1 <- read_csv("plot_bb_1.csv")
plot_bbox_2 <- read_csv("plot_bb_2.csv")
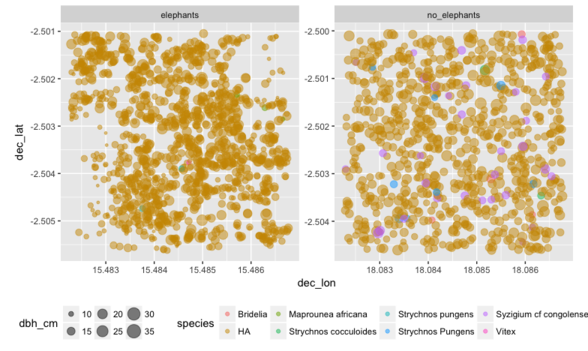
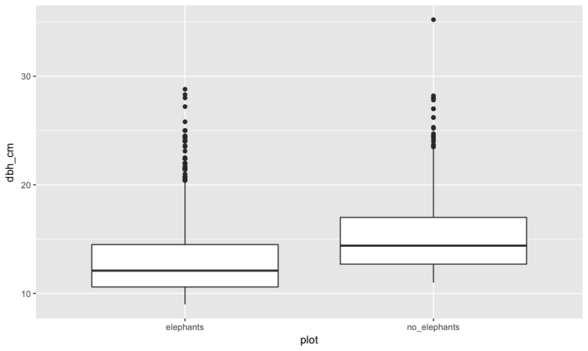
First I want to plot the trees according to their DBH (Diameter at
Breast Height, ~1.3 m), to see if there is a difference between
plots. I'll make a map, and a box plot:
# Plot tree DBH as point size ----
ggplot(tree_loc_diam_1_2_summ, aes(x = dec_lon,
y = dec_lat,
size = dbh_cm,
colour = species)) +
geom_point(alpha = 0.5) +
theme(aspect.ratio = 1) + # coord_map() doesn't work with
facet_wrap()
facet_wrap(~ plot, scales = "free") +
theme(legend.position = "bottom")
# DBH boxplots ----
ggplot(tree_loc_diam_1_2_summ, aes(x = plot, y = dbh_cm)) +
geom_boxplot()
Now I want to create a map that shows how clustered together the
trees are in any given plot. For this I use the handy
stat_density2d geom from ggplot2, and fill according to ..level...
Also I found I had to manually increase the size of the plot,
otherwise the density shading polygons get clipped and look really
messy.
# Is there an effect of elephants on spatial clustering of
trees? ----
# Split data frames
tree_loc_diam_1_summ <- tree_loc_diam_1_2_summ %>%
filter(plot == "elephants")
tree_loc_diam_2_summ <- tree_loc_diam_1_2_summ %>%
filter(plot == "no_elephants")
# Create heatmaps based on density of trees
elephant_plot <- ggplot(tree_loc_diam_1_summ, aes(x = dec_lon,
y = dec_lat)) +
stat_density2d(aes(fill = ..level..), geom = "polygon") +
scale_fill_viridis() +
geom_polygon(data = plot_bbox_1, aes(x = dec_lon, y =
dec_lat), fill = NA, colour = "black") +
geom_point(size = 0.8) +
xlim(min(plot_bbox_1$dec_lon) - 0.001,
max(plot_bbox_1$dec_lon) + 0.001) +
ylim(min(plot_bbox_1$dec_lat) - 0.001,
max(plot_bbox_1$dec_lat) + 0.001) +
xlab("Decimal Longitude") +
ylab("Decimal Latitude") +
theme_classic() +
theme(legend.text = element_text(size = 10),
axis.text = element_text(size = 10)) +
labs(fill = "Tree Density")
no_elephant_plot <- ggplot(tree_loc_diam_2_summ, aes(x =
dec_lon, y = dec_lat)) +
stat_density2d(aes(fill = ..level..), geom = "polygon") +
scale_fill_viridis() +
geom_polygon(data = plot_bbox_2, aes(x = dec_lon, y =
dec_lat), fill = NA, colour = "black") +
geom_point(size = 0.8) +
xlim(min(plot_bbox_2$dec_lon) - 0.001,
max(plot_bbox_2$dec_lon) + 0.001) +
ylim(min(plot_bbox_2$dec_lat) - 0.001,
max(plot_bbox_2$dec_lat) + 0.001) +
xlab("Decimal Longitude") +
ylab("Decimal Latitude") +
theme_classic() +
theme(legend.text = element_text(size = 10),
axis.text = element_text(size = 10)) +
labs(fill = "Tree Density")
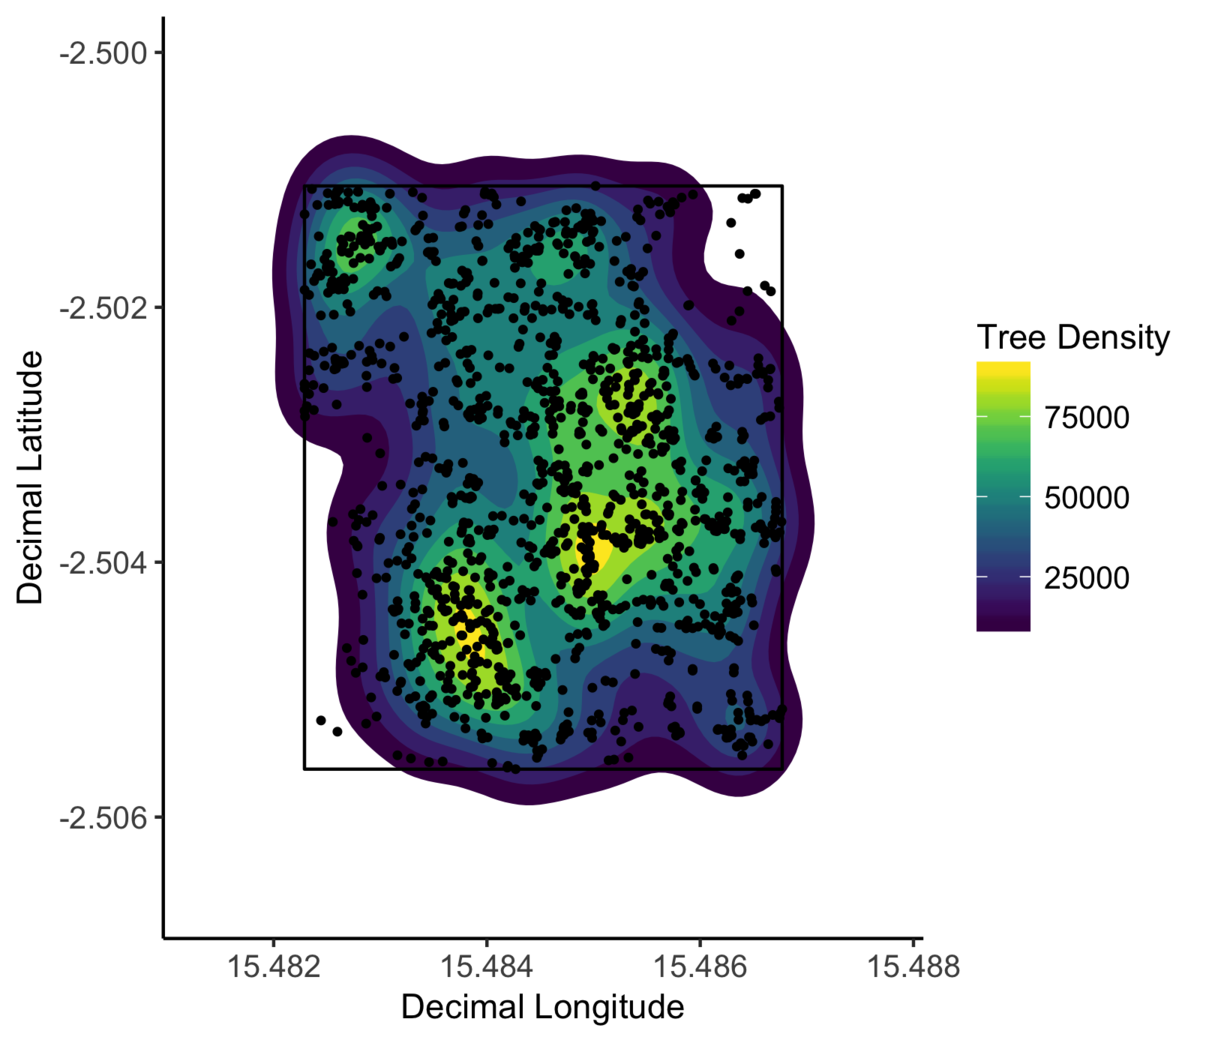
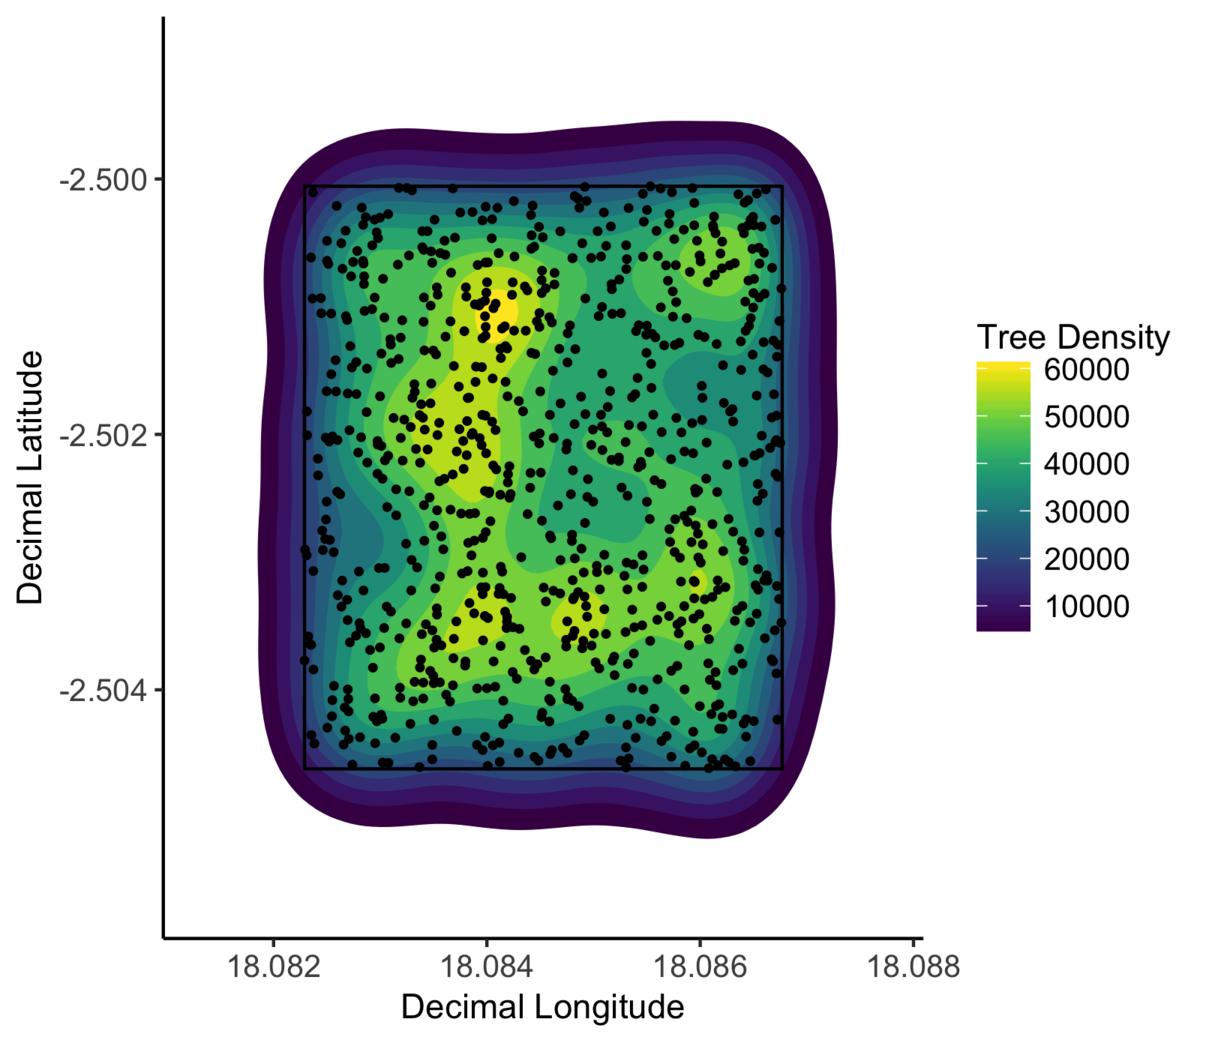
The spatial clustering of trees in a plot with elephant activity
(left) and without elephant activity (right). Elephants clearly
have caused spatial clustering of trees.