This is a text-only version of the following page on
https://raymii.org:
---
Title : Line total (up+down sum) in PHP Network Weathermap
Author : Remy van Elst
Date : 13-11-2018
URL :
https://raymii.org/s/tutorials/Line_total_up_down_sum_in_php_weathermap.html
Format : Markdown/HTML
---
With PHP Network Weathermap you can create a birds-eye view of network
components from your monitoring system (like LibreNMS, Cacti or anything else
with an RRD database). It can display simple maps with components and links
between, showing up and down traffic, but also complex systems with custom
components, like Nagios status, temperature or other information. For network
and system administrators seeing the seperate in and out traffic of a link is
fine, we can sum up two numbers. A co worker filling the role of service manager
asked me if it was possible to sum up in and out and show that, including the
scale (different colours depending on link usage). This co worker is not
interested in the seperate up/down link speed but wants to know how much traffic
a location is using in total. Using a clever workaround, you can display a
line's total usage, including the scale. This article also gives some more tips
on weathermap, colouring and scale.
<p class="ad"> <b>Recently I removed all Google Ads from this site due to their invasive tracking, as well as Google Analytics. Please, if you found this content useful, consider a small donation using any of the options below:</b><br><br> <a href="
https://leafnode.nl">I'm developing an open source monitoring app called Leaf Node Monitoring, for windows, linux & android. Go check it out!</a><br><br> <a href="
https://github.com/sponsors/RaymiiOrg/">Consider sponsoring me on Github. It means the world to me if you show your appreciation and you'll help pay the server costs.</a><br><br> <a href="
https://www.digitalocean.com/?refcode=7435ae6b8212">You can also sponsor me by getting a Digital Ocean VPS. With this referral link you'll get $100 credit for 60 days. </a><br><br> </p>
### Example
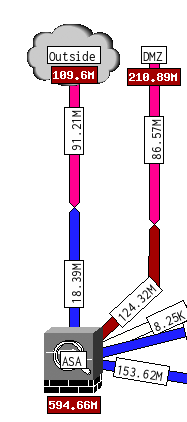
The picture below shows a section of a weathermap to a location, where the line
is a 20 mbit line. The first picture is without the total summary. Green means
40-50% usage and yellow means 55-70% usage. It is not very clear that the line
is at max capacity if you just see yellow and green:
![][2]
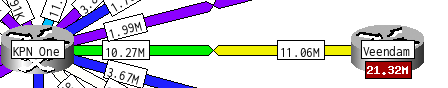
By adding the total (sum of up and down) it is clear right away that this line
is at max capacity:
![][3]
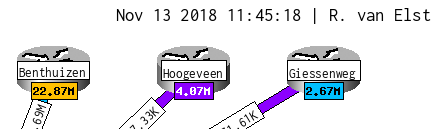
Here is another example:
![][4]
### Configuration
The weathermap has the concept of "nodes" and "links". A node has one or more
links and a link is between two nodes. A link has a "target", which points to an
RRD file in most cases. There is no math support in the configuration syntax, so
you cannot say "up + down" in the label. But, you can add multiple RRD files to
the "target" of a link, for example when you want to show multiple lines which
form one logical unit.
I found a forum post that stated that "nodes" can also have targets. You can do
more advanced mapping with custom data formats with this, but in our case we can
also use it to sum up the links.
The trick is that a target configuration line has this format:
filename.rrd:INOCTETS:OUTOCTETS
By replacing the parameters with a dash (`-`), that part is ignored. So, we can
add the same RRD file two times and specifying the `INOCTETS` and `OUTOCTETS` as
"in" and placing `-` as out. The weathermap will add up all the "in" data,
which, because we added the same file, is a sum of up and down. Here is an
example, for a 10 mbit line:
NODE amersfoort
LABEL Amersfoort
INFOURL https://[...]/librenms/device/device=461/
OVERLIBGRAPH https://[...]/librenms/graph.php?width=...
ICON images/Router.png
POSITION 580 280
NODE amersfoortSUM
LABEL {node:this:bandwidth_in:%k}
LABELFONT 3
LABELFONTCOLOR contrast
TARGET ./amersfoort/port-id10886.rrd:INOCTETS:- ./amersfoort/port-id10886.rrd:OUTOCTETS:-
POSITION amersfoort 0 +20
MAXVALUE 10M
In the [documentation][5] this is explained:
> You can also specify '-' for either DS name, which tells Weathermap to ignore
this rrd file for the purposes of the input or output value. This is mainly
useful in combination with the aggregation feature, where you can take the input
data from one rrd file, and the output data from another.
We do a few things next to the two target files. As you can see, the `LABEL`
line is:
{node:this:bandwidth_in:%k}
These advanced parameters are explained in the [Weathermap advanced
documentation][6].
The `POSITION` is relative to the "amersfoort" node. Since there is no way to do
newlines in a label (due to [gd issues][7]) I choose this way. Also, this way
the label of the actual node stays white, which makes the entire drawing less
cluttered.
The `MAXVALUE` line in the `NODE` part is the same as the `BANDWIDTH` part of a
`LINK`. This value is needed for the `SCALE`.
The `LABELFONTCOLOR contrast` is one of those other wonderfull well thought
through parts of this software. Depending on the scale and load, the background
of the link or node can be dark or light. If you manually specify this node to
have a white background, then that will be hard to read when the load is 0-1% or
40-70%, since those loads trigger a white, light yellow or light green
background.
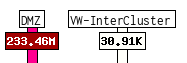
The contrast option lets the weathermap figure out what text colour is best for
this scale. So, dark scale colours have white text and light scale colors have
black text. These two example show that:
![][8]
![][9]
To get the total amount for a device with many ports, like an 48 port switch,
you can use a for loop to get the correct syntax. This example is for LibreNMS,
but speaks for itself (go to correct folder, loop over all files):
cd /opt/librenms/rrd/
for i in ./device.ext/port-id*.rrd; do echo -n "$i:INOCTETS:- $i:OUTOCTETS:- "; done
You should place the entire line (make sure there are no newlines) after the
`TARGET` section in the `NODE`.
### Scale
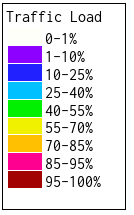
I've slightly changed the default scale, adding one step from 95% to 100%, the
default is 85% to 100%. Here is the scale image:
![][10]
This is the weathermap config:
KEYPOS DEFAULT 14 580 Traffic Load
KEYTEXTCOLOR 0 0 0
KEYOUTLINECOLOR 0 0 0
KEYBGCOLOR 255 255 255
BGCOLOR 255 255 255
TITLECOLOR 0 0 0
TIMECOLOR 0 0 0
SCALE DEFAULT 0 0 192 192 192
SCALE DEFAULT 0 1 255 255 250
SCALE DEFAULT 1 10 140 0 255
SCALE DEFAULT 10 25 32 32 255
SCALE DEFAULT 25 40 0 192 255
SCALE DEFAULT 40 55 0 240 0
SCALE DEFAULT 55 70 240 240 0
SCALE DEFAULT 70 85 255 192 0
SCALE DEFAULT 85 95 255 0 144
SCALE DEFAULT 95 100 163 1 1
SET key_hidezero_DEFAULT 1
If you have capacity problems, it's helps (in our case at least) to see just a
bit more detail, like so:
![][11]
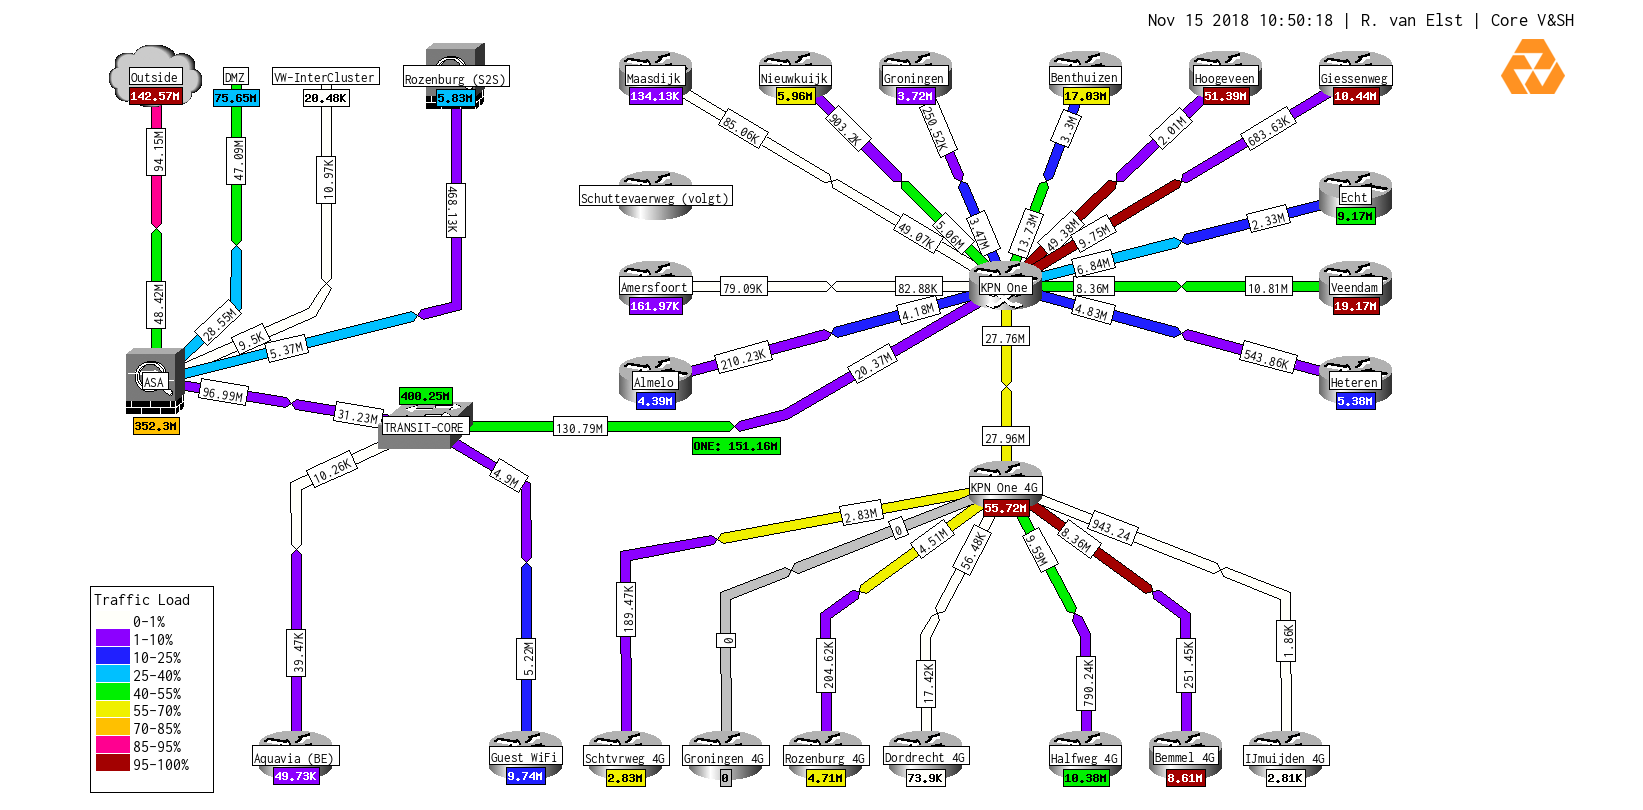
### Weathermap example
The below picture shows one of my weathermaps for a network overview of all the
satelite locations (connected to one main office via an MPLS network):
[![][12]][12]
[1]:
https://www.digitalocean.com/?refcode=7435ae6b8212
[2]:
https://raymii.org/s/inc/img/weathermap-1.png
[3]:
https://raymii.org/s/inc/img/weathermap-2.png
[4]:
https://raymii.org/s/inc/img/weathermap-8.png
[5]:
http://web.archive.org/web/20180418105654/http://network-weathermap.com:80/manual/0.97b/pages/targets.html#rrd
[6]:
http://web.archive.org/web/20181113105036/https://network-weathermap.com/manual/0.97b/pages/advanced.html
[7]:
http://web.archive.org/web/20181113120849/https://forums.cacti.net/viewtopic.php?f=16&t=47901
[8]:
https://raymii.org/s/inc/img/weathermap-4.png
[9]:
https://raymii.org/s/inc/img/weathermap-6.png
[10]:
https://raymii.org/s/inc/img/weathermap-3.png
[11]:
https://raymii.org/s/inc/img/weathermap-5.png
[12]:
https://raymii.org/s/inc/img/weathermap-7.png
---
License:
All the text on this website is free as in freedom unless stated otherwise.
This means you can use it in any way you want, you can copy it, change it
the way you like and republish it, as long as you release the (modified)
content under the same license to give others the same freedoms you've got
and place my name and a link to this site with the article as source.
This site uses Google Analytics for statistics and Google Adwords for
advertisements. You are tracked and Google knows everything about you.
Use an adblocker like ublock-origin if you don't want it.
All the code on this website is licensed under the GNU GPL v3 license
unless already licensed under a license which does not allows this form
of licensing or if another license is stated on that page / in that software:
This program is free software: you can redistribute it and/or modify
it under the terms of the GNU General Public License as published by
the Free Software Foundation, either version 3 of the License, or
(at your option) any later version.
This program is distributed in the hope that it will be useful,
but WITHOUT ANY WARRANTY; without even the implied warranty of
MERCHANTABILITY or FITNESS FOR A PARTICULAR PURPOSE. See the
GNU General Public License for more details.
You should have received a copy of the GNU General Public License
along with this program. If not, see <
http://www.gnu.org/licenses/>.
Just to be clear, the information on this website is for meant for educational
purposes and you use it at your own risk. I do not take responsibility if you
screw something up. Use common sense, do not 'rm -rf /' as root for example.
If you have any questions then do not hesitate to contact me.
See
https://raymii.org/s/static/About.html for details.