This is a text-only version of the following page on
https://raymii.org:
---
Title : Essential Monitoring checks
Author : Remy van Elst
Date : 20-03-2018
URL :
https://raymii.org/s/articles/Essential_Monitoring_checks.html
Format : Markdown/HTML
---
![][1]
In this article I'll provide a list of checks I consider essential for
monitoring and why they are usefull. It's on different levels, ranging from your
application (health checks), to operating system (disk usage, load) and hardware
(iDrac, disks, power). Use it as a starting point when setting up your
monitoring.
These checks can be setup in many different monitoring systems and with many
different technical solutions. One solution might be Nagios/Icinga2 with
`nrpe`/`nsca`, one might be PRTG with snmp or one might be Pingdom. This list is
meant for you to look at and think, this could be usefull in our setup, then
implement it in your own system.
If you have no monitoring at all, I recommend looking into Icinga2 or Nagios,
but that's just personal preference. Read an [install guide][2] and check out
[all my monitoring articles here][3].
<p class="ad"> <b>Recently I removed all Google Ads from this site due to their invasive tracking, as well as Google Analytics. Please, if you found this content useful, consider a small donation using any of the options below:</b><br><br> <a href="
https://leafnode.nl">I'm developing an open source monitoring app called Leaf Node Monitoring, for windows, linux & android. Go check it out!</a><br><br> <a href="
https://github.com/sponsors/RaymiiOrg/">Consider sponsoring me on Github. It means the world to me if you show your appreciation and you'll help pay the server costs.</a><br><br> <a href="
https://www.digitalocean.com/?refcode=7435ae6b8212">You can also sponsor me by getting a Digital Ocean VPS. With this referral link you'll get $100 credit for 60 days. </a><br><br> </p>
This is quite a lengthy article, but using the table of contents you can skip
directly to the sections relevant to you.
### What to monitor and when to alert?
The short answer is `monitor as much as possible, escalate as few times as
possible`.
To expand on that, from the perspective of a systems administrator, more metrics
and checks are better. Just as more logging and more documentation. Checks and
monitoring on every level and aspect of your environment help to diagnose issues
early on and make sure they don't happen again.
Monitoring helps when doing a post-mortem. To be able to see what failed, why it
failed and what other things were affected is the holy grail during incident
management. It saves time for you as a sysadmin, and thus downtime for your
users. Not only because you can pinpoint problems faster due to not having to
dig everywhere, but also because you can focus on actual work instead of
firefighting because everything is always broken.
You however don't want to be alerted for every issue. Many checks are allowed to
fail or reach a certain threshold before things get critical. Environments I
build are always redundant and highly available, so I don't want to be awakend
because one disk somewhere is nearly full. I don't even want to be awakened when
two of the three datacenters / amazon regions are burning down, as long as the
application / service is still working. The next business day I do want to look
at my dashboards and see that something went wrong, but as long as the actual
service was working, don't bother me. That's why I build high available systems,
so that any component can fail without impact.
I do want to know when issues arise, so email alerts for all notifications are
fine. I can work on those alerts when I have the time, and implement structural
fixes instead of hotfixes.
Whenever a more critical component fails, I'd like to get a text message /
[Pushover][5]. One example is when a database reports one or more cluster
members have failed, or when a cluster file system (like DRBD or GlusterFS) are
in a degraded state. That is a failure that the cluster should be able to
tolerate, but does require fixing. I can still decide when I fix that, but some
alerts have a bit more urgency then just an email.
When the application or service provided to the users fails, I want to be
called. When I'm called it's urgent and on fire, must be fixed now. In the
article I'll go in to different levels of alerting more per check.
Summarizing the above, I like to use three levels of alerting:
* issue, but not critical: email
* issue or failure of a cluster component: text / pushover message
* failure of service alltogether (SLA): call
You can delegate different types of alerting to more junior members of your
team. By doing that, they are learning about the environment, you have less work
to do and your documentation is checked as well.
By decreasing the amount of alerts that require direct action, you also create a
calmer work environment, thus resulting in happier sysadmins.
#### Metrics
Nagios and many other monitoring systems support saving history of alerts and
metrics. Nagios calls this [performance data][6]. Using a third party tool like
[nagiosgraph][7], or more modern, [Grafana][8], you can turn these metrics into
graphs and dashboards.
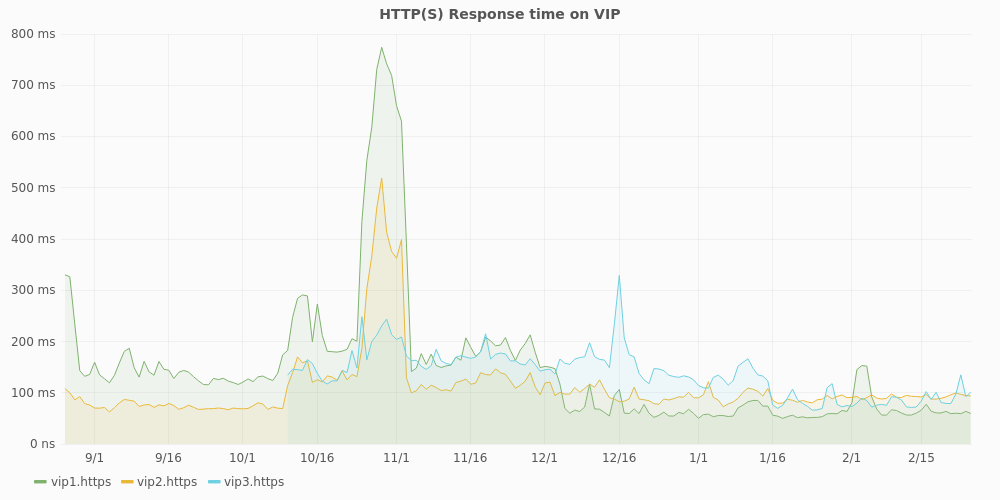
Here is an example of the perfdata from the `check_http` plugin sent to `statsd`
and graphed via Grafana:
![][9]
In this graph, of the past 6 months, you can see 1 extra VIP (virtual IP, the
loadbalancer high available IP) being added and this specific cluster having
performance issues for about 10 days, as the response time goes from an average
of 200 ms to 800 ms.
Using metrics and easy to view graphs like these allow you to quickly get an
overview and historical state of your checks. They help to search down
'hunches', but can also confirm that everything is running smoothly for the past
months.
Graphs are especcialy usefull for latency checks, like disk performance, load or
response times.
### Application
With `application`, I mean the software you run on top of your server (or server
cluster). This can be a website, CMS like Wordpress, but also an application
service like `jboss`, custom software or whatever. The thing that is providing
service to your users, or part of the service (like an API gateway, `tyk`).
#### Health check
The most important check of them all, the application health check. This is a
check that your application handles, and based on the result of that check, in
most cases, gives an HTTP 200 OK or a HTTP 500 internal server error. The check,
which you must probably write yourself, checks all essential things the
application needs to work correctly.
In the case of an ERP system it could be the local database, the vendor stock
management API and the payment API.
In case of a media (video) system this could be the the backend which houses all
the actual content, the DRM service and the customer database.
This check is, in my opinion, one of the few checks that should alert you by
phone (or something that wakes you up at night). If this check fails, so will
the application and thus the service to your users. If you've correctly setup
your high available redundant cluster any one part of it can fail without
alerting you, but if the application health check fails, you should be woken up.
Using the other monitoring you have (but which only alerts via email for
example), you're able to quickly find and fix the issue at hand.
#### HTTP/HTTPS check
In the case of a web application, a check on the HTTP(s) status code. 200 means
all is well, anything else probably means something is wrong.
Example output from Nagios:
HTTP OK: HTTP/1.1 200 OK - 11595 bytes in 0.001 second response time
If this check is triggered, your webserver has an issue. Check the logs for more
information. Examples I've seen are the application server (like PHP, mod_python
or Passenger) not working correctly, or someone making a mistake in a
`.htaccess` file or `nginx` config.
#### Brute force login
If your application deals with login and user accounts, it is great to know when
a brute force is going on. You must also have brute force protection, read the
[OWASP top 10 2017][10] for more tips on that. Even though, a high load due to
brute force attempts (logins can't be cached thus hit your database every time)
is not a nice thing to have.
Just as the health check this is one of those checks that you must probably
write yourself. Combine it with something like `fail2ban` for automatic blocking
after a set amount of failed attempts.
#### API test
If your application is dependent on external API's, it's a good thing to check
the endpoints. Try to make a check that mimics something your application would
do. Alert when it fails, your external provider might have an issue, or changed
its API. This will help you diagnose issues quickly before your application
fails.
This check could be integrated in the applicaton health check. I know of a
television station which checks all their external content provider API's this
way so they know when the providers fail to meet their SLA's.
#### Certificate expiry
Again just for web applications, check when your certificates expire. Example
output from Nagios:
OK - Certificate 'www.raymii.nl' will expire on Fri 29 Jun 2018 12:59:00 AM CEST.
Let this check alert a month in advance to cover for vacation or validation
issues with the certificate. If you use Let's Encrypt, make it 7 days or the
like, since that's more automatic.
If you have an Extended Validation certificate, let it alert 2 to 3 months ahead
to cover any validation issues.
#### Application functional tests
This one falls in the same category as the health check. You can have many of
these with lower alerting levels. This check does one thing as part of your
application. For a webshop, this could be placing an order and checking if the
confirmation email is received. And of course removing that order afterwards.
For a certificate authority, this could be requesting a certificate and checking
the serial and expiry date of the given certificate.
For a cloud provider, this could be creating a VM, attaching an extra disk,
checking if the extra disk works, if the IP pings, and then removing the VM.
This way multiple parts of the system are touched in a way users also would do.
Not all problems are caught this way, for example, if you have multiple
hypervisors, one could have an issue but the check could create the VM on a
hypervisor without isssues, but that should be caught by your detailed
monitoring of that specific hypervisor.
Here is some example output of one of the checks my current work does on their
hypervisor platform:
OK: All tasks completed: Created instance with uuid $uuid: Pinging the server on ip $ipaddr successfull for 20 times after 34 attempts: SSH connection to $ipaddr successfull: Created volume with uuid $uuid: Attached volume successfully: Volume mounted in instance successfully: Deleted instance: Deleted volume
When the check fails, for example when the volume service (`cinder`) scheduler
had an issue:
ERROR: Created instance with uuid $uuid: Pinging the server on ip $ipaddr successfull for 20 times after 34 attempts: SSH connection to $ipaddr successfull: Created volume with uuid $uuid: Task attachVolume failed: Timeout waiting for $uuid to transition to in-use: Deleted instance: Deleted volume
Another functional check we have is how many usable public IP's are allocated.
If that falls below a certain number that can be the cause of a non-working
service (as in your VM has no IP):
OK: 8924 Usable Public IP's
When a certain threshold is reached:
WARNING: 800 Usable Public IP's
That way we know when it's time to add a new subnet to Neutron.
A functional check can also include a latency check, for example, if you run a
file service that download times on files are not lower than X. In that case,
the definition of a working service requires X speed, and the functional test
can help you with that.
As you can see, functional checks can be as wide and varied as possible. They
are valuable because they 'hit' multiple levels of your stack and can help
diagnose problems earlier. They are not the holy grail, because they are
generic. In the case of the VM creation check, we can see that somewhere in the
volume part there is a failure. Dedicated monitoring of that service showed that
the scheduler stopped, but it we didn't had that monitoring finding the actual
cause would be difficult. Not to say that it is not a valuable check, it should
not be the only one to rely on.
### Services
With `services` I mean applications providing a service on top of the operating
system. For example, Active Directory, MSSQL, your database, web server, load
balancer or cluster software. Anything that is not directly the hardware or
operating system, but also not your application or service itself.
The lines are a bit blurry, because a process check, is that OS or service? I
list those under OS, but they could just as well fall under services. If your
service is providing a database, then that would fall under 'Application' here
above, but if the database is a component of your stack, it falls under
services.
I'll list a few of the checks I often utilize below, but of course, they are not
limited to just the ones below. As with this entire article, take what you need
and adapt it to your environment.
#### haproxy backends and frontends
My loadbalancer of choice, because of the features, stability and monitoring /
statistics. Read [this article][11] for a nice overview why `haproxy` is better
most of the times.
In haproxy you define frontends and backends. A frontend can be the point of
entry for your website, the backends can be multiple webservers. The frontend
can also be a TCP port and the backend a collection of redis/mysql servers. This
check, applicable for all load balancers, shows you which frontends and backends
are down (reported by haproxy):
Check haproxy OK - checked 10 proxies.
Failure:
Check haproxy CRITICAL - server: appserver:app1 is MAINT (check status: layer 4 check OK): server: mysql:mysql_master is DOWN (check status: connection error): server: mysql:mysql_backup is DOWN (check status: connection error): BACKEND: mysql is DOWN:
This check is not usefull when you have an active / passive setup, then it will
always alert because the passive systems are down. A two node redis cluster with
haproxy in front as entry point will have one active (MASTER) node and one down
(SLAVE) node. The redis sentinels do a haproxy API call to switch the backend
when required, but never are two redis servers up at the same time (the slave is
read only until promoted to master, then the other master drops all it's data
and resyncs with the new master, as a slave).
I've written a wrapper around this check that only escalates an alert when all
backends are down. Alerting is done via email otherwise, only DOWN and not
MAINTENANCE, since maintenance is deliberate.
#### DNS
If you run your own local resolvers your servers are dependent on them, so they
must return correct results. Not only monitor the actual service itself, but
also it if returns correct results. Using this Nagios check, we specify the
hostname and the expected IP's in return. This check works with all records
types (A, AAAA, MX, TXT etc.) thus can also be used to check if your MX records
are still there and such. Very usefull in an environment where multiple people
do DNS changes. Sometimes errors are made, like that BIND used `;` as a comment
character instead of `#`, and you don't want to have two hours without DNS.
Response time can also be alerted on. Example output:
DNS OK: 0.007 seconds response time. identity.stack.cloudvps.com returns 89.31.101.74, 89.31.101.76
Alerting can be email only. It can happen that the alert is a false positive,
because of actual DNS changes.
#### MySQL, Galera (or Postgres)
The database of choice for many people, single server, master-slave or master-
master replication or a full blown Galera cluster. To monitor, I often create a
seperate user (named `monitoring`). The Nagios plugin example output is listed
below:
Uptime: 1381613 Threads: 4 Questions: 4459389 Slow queries: 16 Opens: 12935 Flush tables: 1 Open tables: 400 Queries per second avg: 3.227
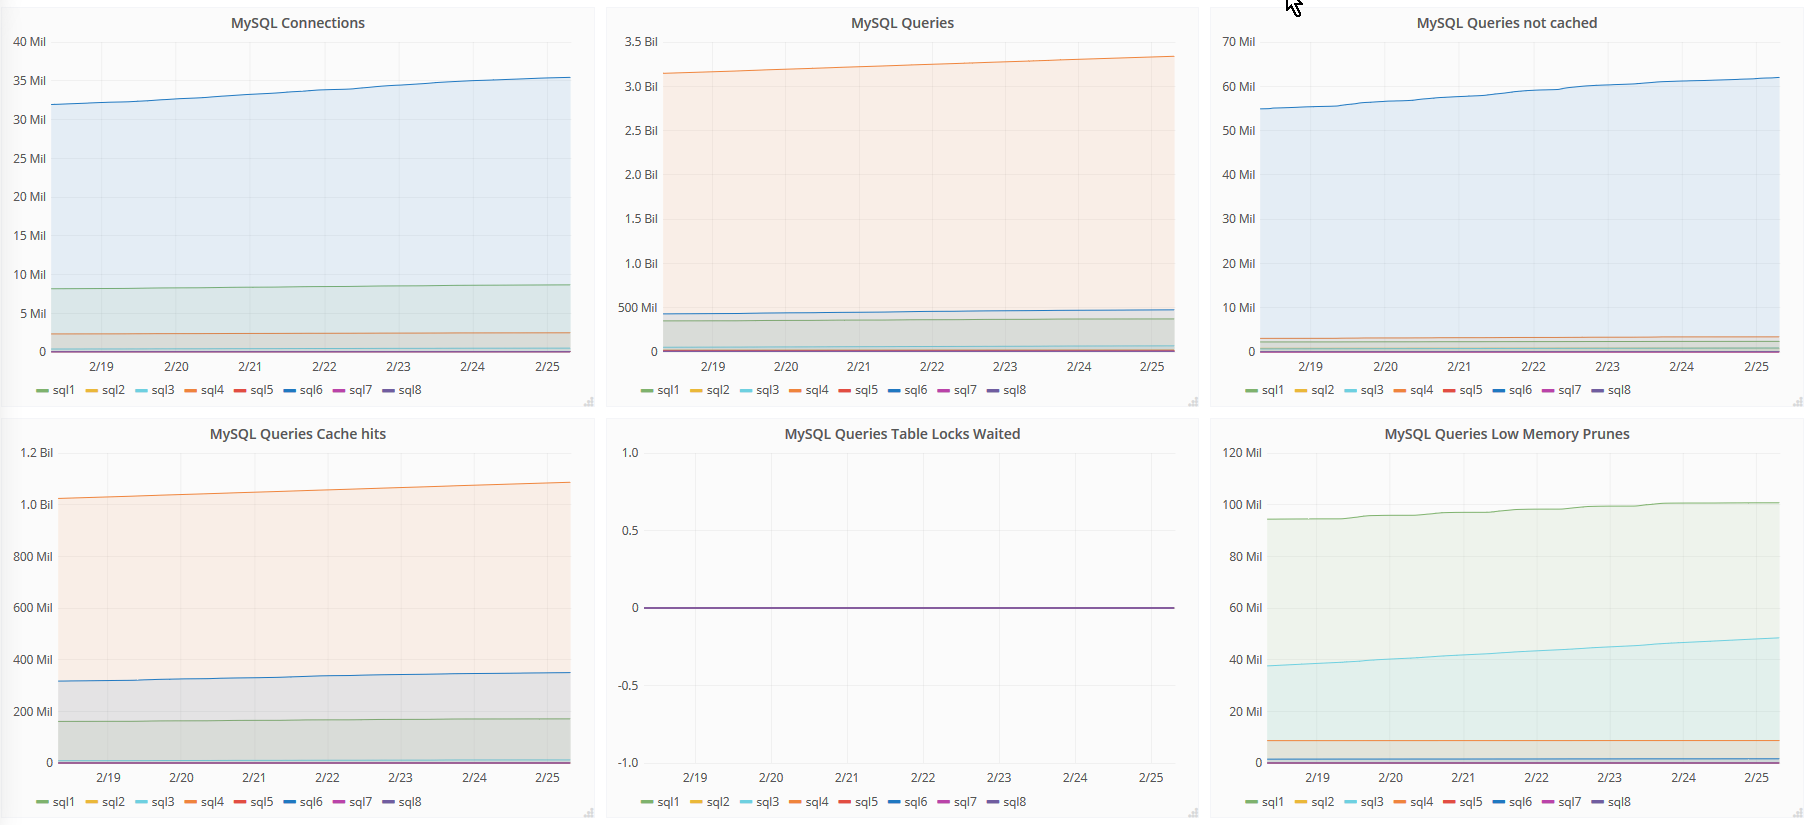
This check put in a graph looks like [this][12]. Usefull to have when a new
version of your application is deployed and there is a tenfold increase in
queries and cache misses.
If you run a replication or cluster setup, it is important to check that as
well. The replication checks I use looks like this:
OK - Waiting for master to send event, replicating host 10.0.0.100:3306
Failure:
CRITICAL - Replication problem: Slave IO not running!
For Galera I use [this check][13] which alerts if there are problems with the
amount of nodes in the cluster.
In my use cases, I don't let this check escalate, since the application health
check catches this as well and that check already escalates.
#### Corosync
Corosync (and pacemaker) is the cluster resource manager. This service ensures
that clustered resources and resource groups only run on the correct nodes and
ensure failover when required. One of the most important parts in a cluster
setup. It can cluster almost anything, but I most often use it for `drbd`
(filesystem), `postgres` (database) and high-available OpenStack instances with
[Masakari][14].
We have different checks on corosync, the generic one checks the status of all
rings, if [stonith][15] is enabled, if maintenance mode is not enabled and if
there are no failed actions:
OK - ring 0: Ok, ring 1: Ok, failed: Ok, stonith: Ok, maintenance: Ok
OK: status = ring 0 active with no faults
OK: status = ring 1 active with no faults
OK: CRM master
OK: No failed actions present...
OK: Stonith is enabled...
OK: Maintenance Mode is inactive...
It alerts with a warning when maintenance mode is enabled:
WARN - ring 0: Ok, ring 1: Ok, failed: Ok, stonith: WARN, maintenance: WARN
OK: status = ring 0 active with no faults
OK: status = ring 1 active with no faults
OK: No failed actions present...
WARNING: Stonith is disabled...
WARNING: Maintenance Mode is active...
When the cluster starts failing, it will escalate:
CRIT - ring 0: Ok, ring 1: Ok, failed: CRIT, stonith: CRIT, maintenance: CRIT
OK: status = ring 0 active with no faults
OK: status = ring 1 active with no faults
CRITICAL: could not connect to CRM...
CRITICAL: could not connect to CRM...
CRITICAL: could not connect to CRM...
One extra check I enable specificaly to catch maintenance errors is a check on [moved resources][16]:
OK: Manual move is inactive...
With `crm resource move`, if you leave out the expiry time, the resource will
never run on that node until it is `cleared`/`unmoved` ([manpage][17]). If you
forget to clear a resource and the other nodes fail, even when this node is
healthy, the cluster will not move it there resulting in an outage. This check
reminds you that you have uncleared resources, so that when you've finished your
maintenance you don't forget to clear the resource.
#### Application server (php-fpm, passenger, unicorn etc)
When running web applications with a scripting language like Python (django),
Ruby (Rails) or PHP often there is an application server involved. Often this is
`php-fpm` for PHP or `passenger` for Ruby on Rails and Python. For Passenger
[there is a nice check here][18] that reports user data as well.
If for whatever reason your application server fails, your application health
check will go off and it will be escalated. If you have a loadbalanced setup,
the other servers will take over and your application health check should not
alert or escalate, but you still want to know that this one server is having
problems. Most often, this check will go off and the `haproxy` check described
above will also go off.
#### GlusterFS
GlusterFS is a clustered file system. It allows multiple servers to have the
same filesytem, both via NFS, SMB or it's own filesystem module. When your
application is not cluster-ready or is heavily dependent on local files
GlusterFS is usefull. Or when you have to provide high-available file sharing
services. It is a tad bit slower than `nfs` with `drbd`, but provides more
features (like bitrot detection, geo-replication and advanced cluster controls).
[This plugin][19] for recent versions of GlusterFS (> 3.7) and [this pugin][20]
for older versions are both good. The number of bricks, daemon status, volume
status, diskspace and healing status are checked.
I don't let this check escalate, since the application health check will also
escalate when its filesystem disappears.
#### nfs/drbd
NFS and DRBD, combined with CoroSync, is in my opinion the only fast shared
filesystem. It's simple, stable and many operating systems talk NFS. DRBD is
'RAID 1' over the network. A three node setup has [always been a bit more work
to setup][21], but with version 9 [this is now very easy and built in][22].
The check checks if the device is connected and in sync/consistent. Output:
DRBD OK: Device 0 Connected UpToDate
When doing a resync, for example after a resize:
DRBD WARNING: Device 0 SyncSource UpToDate
Failure:
DRBD CRITICAL: Device 0 SyncTarget Inconsistent
DRBD CRITICAL: Device 0 WFConnection UpToDate
I don't let this check escalate, since the application health check will also
escalate when its filesystem disappears.
#### Redis
Redis is a fast, in memory, key-value store. It can be clustered, but only 1
node can be the master at any given time. The [docs on clustering][23] are
excellent. Slaves are read-only and Sentinels monitor the state of the cluster
and can trigger failovers.
My monitoring of redis is limited to [this check][24] on the active master and a
process check of `redis` and `redis-sentinel` on the slaves and sentinels.
##### Quorum
Any cluster setup has to have a Quorum component. Simply explained, the Quorum
is the number of nodes required to keep the cluster running. If the Quorum is
not met, the cluster stops functioning to prevent split-brain situations.
A quorum must be an odd number, minimum of three. If you have a five node
cluster, the Quorum can be three. If you have a three node cluster, the quorum
must be three. Two node clusters cannot have a quorum, since if one node fails
the other is unable to verify that itself is failed or the other node is failed.
You can disable the Quorum and run a 2 node cluster, but that will give a high
risk of split brain and related issues.
Do note that the above is very much a simplified explanation. [Microsoft][25]
has a nice article covering the Quorum in a Hyper-V failover cluster setup.
If you run any type of cluster, be sure to monitor the quorum, whichever way
possible.
##### Ceph
Ceph is the best thing for high-available storage since sliced bread.
[Wikipedia][26] has the best description, so I'm not going to cover it here.
The checks I run on a ceph cluster are checks of the different components
(`mon`, `mds` and `osd`). The OSD check, basically all the disks underneath
Ceph:
Ceph OSD down: 0
Failure:
Ceph OSD down: 8
On the storage servers itself there also runs a check on the actual OSD devices.
When all are available, the check outputs:
DISK OK
Inclusing performance data on how much space is used per OSD:
Label Value Max Warning Critical
/var/lib/ceph/osd/ceph-5 640.77 GiB 3.63 TiB 2.72 TiB 3.08 TiB
/var/lib/ceph/osd/ceph-76 602.44 GiB 3.63 TiB 2.72 TiB 3.08 TiB
When a disk fails:
DISK CRITICAL - /var/lib/ceph/osd/ceph-86 is not accessible: Input/output error
The ceph cluster health is also checked. If all is well, not much output:
HEALTH_OK
When a disk has failed, the health check output more information that is used in
debugging:
HEALTH_WARN 239 pgs degraded: 41 pgs stuck unclean: 239 pgs undersized: 100 requests are blocked > 32 sec: 1 osds have slow requests: recovery 337342/53695956 objects degraded (0.628%): 1/213 in osds are down
pg 2.9dd is stuck unclean for 302.205938, current state active+undersized+degraded, last acting [189, 187]
pg 2.8d5 is stuck unclean for 304.844369, current state active+undersized+degraded, last acting [178, 35]
pg 2.840 is stuck unclean for 304.032332, current state active+undersized+degraded, last acting [189, 214]
pg 2.70b is stuck unclean for 317.764231, current state active+undersized+degraded, last acting [179, 178]
pg 2.6dd is stuck unclean for 331.966147, current state active+undersized+degraded, last acting [197, 8]
pg 2.73b is stuck unclean for 303.225730, current state active+undersized+degraded, last acting [187, 178]
pg 2.5f2 is stuck unclean for 307.264681, current state active+undersized+degraded, last acting [175, 173]
pg 2.5a3 is stuck unclean for 322.817106, current state active+undersized+d
When a disk is replaced and the cluster is rebalancing:
HEALTH_WARN 87 pgs degraded: 1 pgs recovering: 86 pgs recovery_wait: 87 pgs stuck unclean: recovery 445/53359560 objects degraded (0.001%)
pg 2.8d5 is stuck unclean for 421.504447, current state active+recovery_wait+degraded, last acting [168, 178, 35]
HEALTH_WARN 51 requests are blocked > 32 sec: 2 osds have slow requests
30 ops are blocked > 65.536 sec on osd.170
7 ops are blocked > 32.768 sec on osd.170
8 ops are blocked > 65.536 sec on osd.190
6 ops are blocked > 32.768 sec on osd.190
2 osds have slow requests
Since Ceph runs the block devices that other servers use to provide storage and
services, if there are major failures, more checks will trigger. If one disk, or
one storage node fails, Ceph handles it without problems, so no escalation.
Combined with the hardware monitoring (below in the article), I do know when a
disk fails or has badblocks and thus needs replacement.
### Operating System
The Operating System, the part that runs your applications and services. Can be
Windows, Linux, BSD or anything else, everything can be monitored. The below
checks are geared towards Linux and BSD but the concepts are applicable to other
operating systems as well.
#### Load
Linux load average should be no higher than the amount of CPU cores in your
system. Load is not the same as CPU usage, [this article][27] explains in detail
what Linux load average means. The 'amount of CPU cores' rule of thumb is what I
use for alerting on the 15 minute load avg.
When all is well:
OK - load average: 1.51, 1.47, 1.47
Too much on a 2 core system (15 min avg):
CRITICAL - load average: 10.19, 5.10, 3.49
I don't escalate this check, since the application health check and other checks
(loadbalancer) will go off as well.
#### CPU usage
The percent of CPU usage and the 7 other states are usefull indicators of
arising problems. If your machine is using 100% CPU all the time, something is
wrong. Incidental bursts are often not a problem, since the capacity is meant to
be used. The performance data of this check is usefull, for example in virtual
environments to catch CPU steal (a hypervisor that is overloaded). [This
article][28] explains the CPU statistics in detail.
Perfdata captured:
Label Value
id 61.4% # CPU idle time
usage 38% # usage %
us 27.6% # user space
sy 7.1% # kernel
si 3.4% # software interrupts
wa 0.5% # idle while waiting on I/O
ni 0% # niced processes
hi 0% # hardware interrupts
st 0% # CPU steal, how long the virtual CPU has spent waiting for the hypervisor to service another virtual CPU running on a different virtual machine.
I only alert on high `wait` or CPU steal on virtual machines, since that is an
indication of something wrong with the hypervisor or storage. No escalation,
since other checks will escalate if needed.
#### RAM and swap
High memory usage on your server, just as CPU usage, can be an indication of
things going wrong. Not a reason to alert just on this check, but this is a nice
one to graph. Memory leaks are easy to find that way.
Example from a hypervisor that is not yet in use:
Memory: OK Total: 773557 MB - Used: 11197 MB - 1% used
When doing a load test on a hypervisor:
Memory: CRITICAL Total: 386939 MB - Used: 383085 MB - 99% used!
Swap, if enabled, is also checked. When all is well:
OK - Memoryusage within acceptable levels
If too much swap is used:
CRITICAL - Memoryusage above critical value of 90%
Generally you don't want your swap to be used, especcialy on hardware with lots
of RAM. On VM's with limited amount of RAM, swap can be usefull, but be sure to
set `vm.swappiness` sysctl to something low.
#### Ping
Ping can be twofold, most of the time you do a ping check from your monitoring
server to the instance you are monitoring. Good for measuring latency and
checking if the host is up or not:
PING OK - Packet loss = 0%, RTA = 3.41 ms
Issues arise when there is lots of latency or packet loss:
PING CRITICAL - Packet loss = 100%
PING CRITICAL - Packet loss = 80%, RTA = 5.80 ms
PING CRITICAL - Packet loss = 0%, RTA = 211.72 ms
Ping checks are used by default in Nagios to check if a host is up or not. If a
ping check fails I let that send a text message / pushover. Not critical, but
still requires more attention than just an email. Do make sure to rate limit
your texts, otherwise a datacenter failure results in hundreds of texts.
Ping can also be used inside of a cluster. Most of my high-available cluster
hosts have a ping check to the load balancer and router of that cluster, to
measure internal network latency. Those checks do not alert, but are just
graphed into dashboards to get an overview of latency.
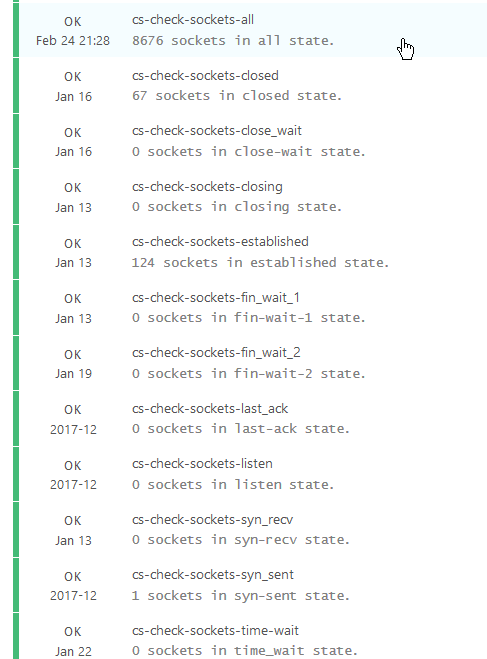
#### TCP Sockets
![][29]
Linux TCP network connections are going through different states. The most often
found states are `LISTEN`, `CLOSED` and `ESTABLISHED`, however during opening
and closing connections different other states can appear. It's not bad to have
connections in that state, but having lots of connections in a particular state
can be a sign of congestion or something that requires performance tuning.
##### TCP Socket state flow
When a connection is opened:
* Client / initiator sends a `SYN` to the server / receiver
* Client marks connection state to `SYN-SENT`
* Server marks connection state to `SYN-RECEIVED`
* Server sends `SYN-ACK` to client
* Client marks connection state to `ESTABLISHED`
* Client sends `ACK` to server
* Server marks connection state to `ESTABLISHED`
When the client wants to terminate the connection:
* Client sends a `FIN` packet to the server
* Client marks connection state `FIN-WAIT-1`
* Server receives termination requests and sends `ACK` to client
* Server marks connection state as `CLOSE-WAIT`
* Client receives reply from server and marks connection state as `FIN-WAIT-2`
The server then has to terminate the connection as well:
* Server, after sending the `ACK` to client, with connection state `CLOSE-WAIT`, sends a `FIN` packet to client
* Server marks state as `LAST-ACK`
* Client receives termination requests and sends `ACK` to server, marks connection as `TIME-WAIT`
* Server marks connection as `CLOSED`
* Client leaves connection in the TIME-WAIT state for a maximum of four minutes (defined by RFC793 and the maximum segment lifetime); then marks connection as `CLOSED` as well.
There's also a three-way handshake alternative available, which occurs when the
server sends its `ACK+FIN` in one single packet (server goes from `ESTABLISHED`
to `LAST-ACK` in a single step).
[This plugin for Nagios][30] works great for monitoring the different socket
states. Busy loadbalancers have a higher limit, and alerting is not enabled.
This is just one of those checks that helps get insight in your environment. I
found out that one client was doing over 5000 redis connections for a single
page load due to wrong configuration in their application for example.
[This is][31] a nice read on tweaking and tuning servers for high performance
and [this article][32] explains how linux network states work in more detail.
With `ss` you can check all tcp sockets and using shell tools sort them by state
and
This is a busy server which runs `haproxy` to redirect everything to `redis`.
Redis is currently also running on that machine.
ss -t -a | awk '{print $1" "$5}' | sort | uniq -c | sort
[...]
42 ESTAB 10.0.0.21:6379
45 ESTAB 127.0.0.1:6378
2585 TIME-WAIT 10.0.0.102:mysql
20679 TIME-WAIT 127.0.0.1:6378
20686 TIME-WAIT 10.0.0.21:6379
ss -t -a | awk '{print $1}' | sort | uniq -c | sort
1 SYN-SENT
1 State
21 LISTEN
237 ESTAB
42850 TIME-WAIT
#### Logged in Users
When you use a configuration management system, you often never have to login to
a server by yourself to install or update stuff. Only when troubleshooting an
issue, but for that you should have your central log cluster. I'm not a big fan
of this check, but there are situations where it is usefull. A jumphost, VPN
server, remote desktop machine, etc. Example check output:
USERS OK - 0 users currently logged in
The default limit is set to 6, but I have it set to 2. No alerting.
* Conntrack
On hypervisors, loadbalancers and routers this is a usefull check to have. The
`iptables` firewall keeps track of connections in the conntrack table. If it's
full, new connections [experience issues][33].
Example output:
OK conntrack table is 0% full and timeout is 14400
Example output when issues arise:
WARN conntrack table is 14% full and timeout is 14400
INFO: tcp connections for src 192.81.222.236 reached CRIT 271464 > 262144
INFO: tcp connections for dst 10.200.10.9 reached WARN 137531 > 65536
INFO: tcp connections for dst 172.32.173.163 reached WARN 137442 > 65536
[More info on conntrack can be found here][34]. [This][35] is the check I use.
On dedicated firewall appliances this kind of check can also be usefull
(Fortigate, Sophos, pfSense etc).
#### Disk space and inodes
One of the more basic checks, because servers act weird when their disks are
full:
DISK OK - free space: / 23150 MB (60% inode=93%): /home/web/domains 30471 MB (74% inode=99%): /glusterfs/xvda3 30472 MB (74% inode=99%):
Warning:
DISK WARNING - free space: / 35606 MB (93% inode=94%): /mnt/export 49504 MB (10% inode=97%):
Make sure to tweak the alert value to your specific setup. By default it's 10%,
but on a 4 TB disk, that is 400 GB and that can be way to much to already alert.
I generally set it to 10 GB.
Do note that this check can also go off when you've ran out of [inodes][36].
Then you have too many files, probably a boatload of small ones (cache anyone).
The used disk space can have lots left, but the inodes (`df -i`) can be all used
up. This check checks both space and inodes.
#### Disk stats, IO wait and IOPS
[check_diskstat][37], [check_iostat][38] and [check_iowait][39] are just like
the connection sockets checks usefull to graph and get insight in the
performance of your environment. Good to kick your VM provider if their platform
has issues with IO performance, especially when you're able to show what stats
are normal.
check_diskstat:
OK - summary: 0 io/s, read 0 sectors (0kB/s), write 816 sectors (1kB/s), queue size 0 in 300 seconds
check_iostat:
OK - I/O stats: Transfers/Sec=649.9 Read Requests/Sec=5.7 Write Requests/Sec=644.2 KBytes Read/Sec=264.4 KBytes_Written/Sec=8341.75
check_iowait
OK - Wait Time Stats: Avg I/O Wait Time (ms)=10.05 Avg Read Wait Time (ms)=11.27 Avg Write Wait Time (ms)=0.50 Avg Service Wait Time (ms)=0.54 Avg CPU Utilization=1.16
No escalating, just graphing.
#### Process checks
The total amount of processes on a machine varies in my experience. A busy
machine can have over a thousand running processes, sometimes more depending on
the hardware. The average VM has around 300-600 running. Another check to give
you more insight in the environment:
Processes running: 10 : Number of context switches last second: 56749
TOTAL PROCS OK: 629 processes
##### Specific processes
For essential programs on a system, for a webserver for example `apache` or
`nginx` and for a database server `mysql`, you want to have a simple check to
see if the process is running. This check will not give you any insight on if
the process actually works, funcionality wise, it could be as dead as doornail,
but it will make sure you know when it is not running.
PROCS OK: 3 processes with command name 'keepalived'
##### Zombie processes
Zooming in further in process checks, [zombie processes][40] are things you
don't want on your system. Check for them:
PROCS OK: 0 processes with STATE = Z
Alert, but not escalate. Zombie processes often are caused by disk IO issues or
failure so your other checks will go off as well.
#### Time (and NTP)
Correct time on your server is important for correct funcionality and logging.
Make sure to always use NTP for correct timekeeping and [a check][41] to show
when you are drifting (time difference):
OK - NTPd Health is 100% with 3 peer(s).
Thresholds: Health (60%, 40%): Peers (2, 1)
------------------------------------------------------
Received 100% of the traffic from +192.170.92.1
Received 100% of the traffic from +192.1.254.130
Received 100% of the traffic from *192.1.254.50
If you use [TOTP][42] in your application, a time difference of more than 30
seconds can be an issue already since the generated codes are invalid and your
users are not able to login.
If you work with short-lived certificates, time difference can also cause huge
problems since valid certificates can be considerend invalid due to servers not
having the correct time.
#### Uptime
System uptime, it's not a contest on who has the largest. High available system
components can all be brought down to be updated or checked without problems for
the service provided. Regular updates, newer kernels, disk checks (fsck) and
general cruft cleanup are reasons use to reboot machines every once in a while.
If a machine reboots itself without being instructed, that can be an issue, a
sign of hardware failure or a disruption at your VM provider. Check the uptime:
System Uptime - up 458 days, 5 Hours, 43 Minutes
Alert when less than 1 hour or more than 100 days. After a hundred days it's
time to apply the updates and do a reboot. Perfect task for your intern or
junior member.
#### cronjobs
Cronjobs can be an important part of your system. Maybe you use one to run your
billing, to run a queue of some sort or to do backups. Whatever the cronjob is,
it can be important to monitor if it ran correctly. There are no ready-made
plugins to do this, but what I use is a combination of a logfile and the
`check_file_age` plugin. Let's say I have a cronjob that runs at midnight and
takes about two hours. The cronjob must log to a file. I set up the
`check_file_age` to alert if that logfile is older than an hour with a
`check_period` just after the cronjob is finished. That way, the check runs
after the cronjob should have finished and only alerts if the logfile has not
been updated.
#### Log parser
Let's say you have an application that logs when something goes wrong, but that
something that goes wrong does require action or is a preface to a larger
failure. You might want to monitor that logfile and alert if that line shows up
in there.
One of my usecases is to check for authentication failures in an internal
application. Not regular authentication where someone enters a password, but
iSCSI authentication. One of the pieces of software that places config files
sometimes has an error where the passwords are incorrect. The manufacturer is
unable to fix this bug so we monitor the iSCSI servers:
OK - There are only 0 instances of "\*\*\*ERROR\*\*\* auth failed" in the last 60 minutes - Warning threshold is 10
OK - There are only 0 instances of "Listen queue overflow" in the last 60 minutes - Warning threshold is 1
Any one of those lines in the log means trouble. Not directly, but every two
hours when the software restarts.
[This plugin][43] is the one I use.
### Hardware
When you manage physical hardware it can be easy to forget that hardware
requires special checks, especially when you are used to just check virtual
machines. But, hardware has many extra quirks. I often say, hardware is stupid
just go to the cloud, as a joke. Hardware requires maintenance, but with
warranty and a reputable provider that is not an issue at al. Even better if you
made your applications redundant, then hardware failure is no problem.
Where in VPSes you just check the OS and software side of things, with server
hardware you also check, well, the hardware. So think, RAM (the actual DIMM's),
disks (bad blocks), RAID config (physical disks, controllers, virtual disks,
battery), network cards (uplink, bonding), temperature (CPU, disks), power
(reduntant PSU status, power usage).
If you have special hardware like network devices, KVM switches, ATSes (Auto
transer switch, to make a device with only single PSU power redundant) or APC's
(remote controlled power bars) you also want to check those.
This overview lists examples of all the hardware checks. As with the entire
article, take from it whatever you like and integrate it in your setup.
#### iDrac/ILO/BMC/ipmi
Many terms for the same thing, the out of band access to your server. Sometimes
with a different NIC, sometimes shared on the internal NIC, sometimes with a
license (Dell/HP) or with all the features (Supermicro). Provides remote access
to the server when it's off (or on), often with console access and other
utilities like firmware upgrades and hardware status.
Dell has the [OpenManage][44] tools, for Supermicro you can use [ipmitool][45].
The Dell iDrac can also be monitored via the XML API on the iDrac webserver
itself.
Both HP and Dell support SNMP for their OOB management.
One way or another, it can provide insight in the server. I use it to monitor
RAM DIMM's, PSU status and usage, RAID status and in the case of Dell the
generic `omreport chassis` output.
Whenever something breaks, we create an RMA request and get it covered in the
warranty.
The main reason to monitor your out of band access is that you want to make sure
it works, because when you need it (there is a problem with the hardware
itself), you don't want to find out that it has been unavailable or not working.
In my case I've written custom checks for the OOB-hardware checks. Some parse
`omreport` commands, others parse web pages or XML files. Some use SNMP.
This is an example of the SNMP Dell DIMM check:
Memory 1 (DIMM Socket A1) 32.0 GB/2400 MHz: ENABLED/OK [26, Hynix Semiconductor, S/N: 2B425762]
Memory 2 (DIMM Socket A2) 32.0 GB/2400 MHz: ENABLED/NONCRITICAL [26, Hynix Semiconductor, S/N: 2B425743]
Memory 3 (DIMM Socket A3) 32.0 GB/2400 MHz: ENABLED/OK [26, Hynix Semiconductor, S/N: 2B425579]
Dimm A2 needs a replacement.
The general `omreport` check:
OK - Fans: Ok, Intrusion: Ok, Memory: Ok, Processors: Ok, Temperatures: Ok, Voltages: Ok, Hardware_log: Ok, Batteries: Ok, Power Supplies: Ok, Power Management: Ok
If it goes off, check the part that is not `Ok` and investigate further.
#### Ports
The main ports I monitor are network uplinks, both RJ-45 and Fiber. Some talk
ethernet, some talk Fabric, but all of them must be up, often in the correct
VLAN. Both in the server as on the router/switch side.
On the switch/router side you can check port status, but also the error counts
on a port. If those are rising, it's probably time to replace your optic or SFP
module.
If you are in an office situation with [port security][46] enabled, which
basically means only select MAC addresses can connect to a port, or with
[802.11x][47] enabled (authentication to get on the network) on, monitoring that
is a big help. If a port suddenly gets blocked you want to go and find out why
(intruder or human mistake)? Or maybe your developer set up virtualbox with his
VM in Bridged mode. Or someone forgot their 802.11x password, or it expired.
Or maybe there are intruders and you catch them before you hit the news.
It also can be good to monitor traffic flow and alert if a port is doing much
more traffic than it regularly does. That can be a hassle to setup correctly, it
will give lots of false positives. But, there are cases where it is usefull.
Perhaps to find an employee leaving their computer on over the weekend to pirate
the latest movoie.
Generally there are checks for major-brand switches and routers available. A
tool like [Observium][48] can be a great addition to your general monitoring
setup.
On the server level you can check if your network bond is still functioning:
OK: bond0 - Bonding Mode: IEEE 802.3ad Dynamic link aggregation - enp341s0f1 (a9:36:9f:0e:d6:5a/up/10000Mbps) - enp342s0f0 (a9:36:9f:0e:d6:30/up/10000Mbps) - enp341s0f0 (a9:36:9f:0e:d6:58/up/10000Mbps) - enp342s0f1 (a9:36:9f:0e:d6:32/up/10000Mbps) - eth1 (24:6e:96:7c:f1:58/up/10000Mbps) - eth2 (24:6e:96:7c:f1:5a/up/10000Mbps)
Failure might indicate a NIC problem or an issue with the switch.
#### Disks, RAID, ZFS and controllers
Storage is stupid because it breaks often. If you've got over 10.000 spinning
disks then one breaks at least once a day. Not a problem in my case since
everything is redundant, both RAID as wel as Ceph, and we've got a dedicated RMA
guy who replaces them. There are a few checks I like to have on my disks and
raid sets. Some are mentioned above in the Ceph section already.
##### Raid array load
Some storage vendors report array load. We've got dedicated arrays for swap
space and regular disks, the swap volume alerts are an indication when a VPS is
swapping heavily:
CRITICAL: vpsvg-935=20 vpsvg-937=60 vpsvg-936=35 vpsswap-967=98(>95)
##### Failed disks
Either a disk is suddenly out of the RAID array, Ceph detects an error or the
disk reports Bad Blocks. All reasons to replace it. Here are different checks we
have for failed disks. First from an HP machine:
RAID ERROR - Arrays: OK:1 Bad:1 - Disks: OK:13 Bad:0
RAID WARNING - HP Smart Array Recovering: Smart Array P420i in Slot 0 (Embedded) array A logicaldrive 1 (136.7 GB, RAID 1, OK) array B logicaldrive 2 (93.1 GB, RAID 1, Interim Recovery Mode)
Dell, disk 14 has Bad blocks:
WARNING - ID=0:1:0 Status=Ok, ID=0:1:1 Status=Ok, ID=0:1:2 Status=Ok, ID=0:1:3 Status=Ok, ID=0:1:4 Status=Ok, ID=0:1:5 Status=Ok, ID=0:1:6 Status=Ok, ID=0:1:7 Status=Ok, ID=0:1:8 Status=Ok, ID=0:1:9 Status=Ok, ID=0:1:10 Status=Ok, ID=0:1:11 Status=Ok, ID=0:1:12 Status=Ok, ID=0:1:13 Status=Ok, ID=0:1:14 Status=Non-Critical, ID=0:1:15 Status=Ok, ID=0:1:16 Status=Ok, ID=0:1:17 Status=Ok,
The controllers and battery:
vdisk OK: Controller0=Ok/Ready [ Battery0=Ok/Ready Vdisk0=Ok/Ready 0 [ 0:1:0=Ok/Online 0:1:1=Ok/Online 0:1:2=Ok/Online 0:1:3=Ok/Online 0:1:4=Ok/Online 0:1:5=Ok/Online 0:1:6=Ok/Online 0:1:7=Ok/Online ] ]
If this check goes to Noncritical then you need to upgrade the firmware.
OpenManage detects old firmwares and alerts.
OK - Controller PERC H730P Mini state is Ready and Controller status is Ok
#### Temperature and fans
Disk temperature should not be to high, CPU and general system temperature
should not as well. Monitoring these values allows you to detect errors in the
cooling system of your datacenter or fan failure. SNMP is used often for these
checks.
System Board Inlet Temp: 22.0 C ENABLED/OK
System Board Exhaust Temp: 38.0 C ENABLED/OK
CPU1 Temp: 46.0 C ENABLED/OK
CPU2 Temp: 44.0 C ENABLED/OK
Fan status and speed:
System Board Fan1A: 8120 RPM - ENABLED/OK
System Board Fan2A: 8120 RPM - ENABLED/OK
System Board Fan3A: 8240 RPM - ENABLED/OK
This model of server has fans that can go up to 9000 RPM. My check is set to
alert when it's OVER 9000!
We have powerbars in our datacenter racks, and we use those to monitor the
ambient temperature in the datacenter. When it goes over 25 degrees we let all
alerts go off and escalate, since we had a major incident once where the cooling
system in the datacenter failed. Using SNMP we monitor the APC power bar for the
temperature.
SNMP OK - Temperature: 231 tenths of degrees celcius
Even if someone works on the rack or leaves the doors open the temperature stays
stable under 25 degrees.
#### Power redundancy and status
A rack often has a maximun amount of power you can draw, for example, 16 A or 32
A. Using this check you can monitor that a server doesn't go above a certain
threshold that will make you use to much power.
OK - Power Consumption in under the warning level psu status
PU 1: ENABLED/OK, RedundancyStatus: FULL, SystemBoard Pwr Consumption: 210 W
We also check the power redundancy status. In Dell servers it requires a
configuration setting to have the power supplies redundant. Not sure why, but
sometimes this changes (after a firmware update) and you don't want to have a
outage because one feed went down.
One last thing we check is the CMOS battery. Also unsure why, but these things
break and can cause strange issues. If this check alerts, we send an RMA and
replace the battery.
System Board CMOS Battery: ENABLED/OK [PRESENCEDETECTED]
[1]:
https://raymii.org/s/inc/img/monitoring.jpg
[2]:
https://raymii.org/s/tutorials/Nagios_Core_4_Installation_on_Ubuntu_12.04.html
[3]:
https://raymii.org/s/tags/monitoring.html
[4]:
https://www.digitalocean.com/?refcode=7435ae6b8212
[5]:
https://pushover.net/
[6]:
http://nagios-plugins.org/doc/guidelines.html#AEN200
[7]:
http://nagiosgraph.sourceforge.net/
[8]:
https://grafana.com/
[9]:
https://raymii.org/s/inc/img/https-graph.png
[10]:
https://www.owasp.org/index.php/Category:OWASP_Top_Ten_Project
[11]:
https://thehftguy.com/2016/10/03/haproxy-vs-nginx-why-you-should-never-use-nginx-for-load-balancing/
[12]:
https://raymii.org/s/inc/img/grafana-mysql.png
[13]:
https://exchange.nagios.org/directory/Plugins/Databases/MySQL/check_galera_cluster/details
[14]:
https://wiki.openstack.org/wiki/Masakari
[15]:
https://en.wikipedia.org/wiki/STONITH
[16]:
https://crmsh.github.io/man-2.0/#cmdhelp_resource_move
[17]:
https://crmsh.github.io/man-2.0/#cmdhelp_resource_clear
[18]:
https://github.com/aredondo/check_passenger
[19]:
https://github.com/atlantos/nagios-check-gluster
[20]:
https://exchange.nagios.org/directory/Plugins/System-Metrics/File-System/GlusterFS-checks/details
[21]:
https://docs.linbit.com/doc/users-guide-83/s-three-nodes/
[22]:
https://web.archive.org/web/20180225072139/https://docs.linbit.com/docs/users-guide-9.0/#s-multi-node
[23]:
https://web.archive.org/web/20180225072427/https://redis.io/topics/cluster-tutorial
[24]:
https://exchange.nagios.org/directory/Plugins/Databases/check_redis-2Epl/details
[25]:
https://blogs.msdn.microsoft.com/clustering/2011/05/27/understanding-quorum-in-a-failover-cluster/
[26]:
https://en.wikipedia.org/wiki/Ceph_(software)
[27]:
http://www.brendangregg.com/blog/2017-08-08/linux-load-averages.html
[28]:
https://web.archive.org/web/20180225080457/http://blog.scoutapp.com/articles/2015/02/24/understanding-linuxs-cpu-stats
[29]:
https://raymii.org/s/inc/img/check_sockets.png
[30]:
https://exchange.nagios.org/directory/Plugins/Network-Connections%2C-Stats-and-Bandwidth/Check-Current-Connections/details
[31]:
https://vincent.bernat.im/en/blog/2014-tcp-time-wait-state-linux
[32]:
https://blog.confirm.ch/tcp-connection-states/
[33]:
https://major.io/2008/01/24/ip_conntrack-table-full-dropping-packet/
[34]:
https://web.archive.org/web/20180225150133/https://securedragon.net/clients/knowledgebase/177/What-is-conntrack-and-how-can-I-check-how-many-sessions-I-am-using.html
[35]:
https://exchange.nagios.org/directory/Plugins/Uncategorized/Software/check_conntrack-2Esh/details
[36]:
https://en.wikipedia.org/wiki/Inode
[37]:
https://exchange.nagios.org/directory/Plugins/System-Metrics/Storage-Subsystem/check_diskstat/details
[38]:
https://exchange.nagios.org/directory/Plugins/Operating-Systems/Linux/check_iostat--2D-I-2FO-statistics/details
[39]:
https://exchange.nagios.org/directory/Plugins/System-Metrics/File-System/Check-IO-Wait-(by-Nestor@Toronto)/details
[40]:
https://en.wikipedia.org/wiki/Zombie_process
[41]:
https://exchange.nagios.org/directory/Plugins/System-Metrics/Time/check_ntp_time-2Epl/details
[42]:
https://en.wikipedia.org/wiki/Time-based_One-time_Password_Algorithm
[43]:
https://exchange.nagios.org/directory/Plugins/Log-Files/check_log3-2Epl/details
[44]:
https://web.archive.org/web/20180311123048/http://linux.dell.com/repo/hardware/omsa.html
[45]:
https://linux.die.net/man/1/ipmitool
[46]:
https://web.archive.org/web/20180311123633/https://www.cisco.com/c/en/us/td/docs/switches/lan/catalyst6500/ios/12-2SX/configuration/guide/book/port_sec.html
[47]:
https://en.wikipedia.org/wiki/IEEE_802.1X
[48]:
https://www.observium.org/
---
License:
All the text on this website is free as in freedom unless stated otherwise.
This means you can use it in any way you want, you can copy it, change it
the way you like and republish it, as long as you release the (modified)
content under the same license to give others the same freedoms you've got
and place my name and a link to this site with the article as source.
This site uses Google Analytics for statistics and Google Adwords for
advertisements. You are tracked and Google knows everything about you.
Use an adblocker like ublock-origin if you don't want it.
All the code on this website is licensed under the GNU GPL v3 license
unless already licensed under a license which does not allows this form
of licensing or if another license is stated on that page / in that software:
This program is free software: you can redistribute it and/or modify
it under the terms of the GNU General Public License as published by
the Free Software Foundation, either version 3 of the License, or
(at your option) any later version.
This program is distributed in the hope that it will be useful,
but WITHOUT ANY WARRANTY; without even the implied warranty of
MERCHANTABILITY or FITNESS FOR A PARTICULAR PURPOSE. See the
GNU General Public License for more details.
You should have received a copy of the GNU General Public License
along with this program. If not, see <
http://www.gnu.org/licenses/>.
Just to be clear, the information on this website is for meant for educational
purposes and you use it at your own risk. I do not take responsibility if you
screw something up. Use common sense, do not 'rm -rf /' as root for example.
If you have any questions then do not hesitate to contact me.
See
https://raymii.org/s/static/About.html for details.