This is a text-only version of the following page on
https://raymii.org:
---
Title : Burn in testing for new Hypervisor and Storage server hardware
Author : Remy van Elst
Date : 08-04-2017
URL :
https://raymii.org/s/blog/Burn_in_testing_for_Hypervisor_and_Storage_servers.html
Format : Markdown/HTML
---
This article talks over how and why to do burn in testing on hypervisor and
storage servers. I work at a fairly large cloud provider, where we have a lot of
hardware. Think thousands of hardware servers and multiple ten thousand
harddisks. It's all technology, so stuff breaks, and at our scale, stuff breaks
often. One of my pet projects for the last period has been to automate the burn-
in testing for our virtualisation servers and the storage machines. We run
OpenStack and use KVM for the hypervisors and a combination of different storage
technology for the volume storage servers. Before they go in production, they
are tested for a few days with very intensive automated usage. We've noticed
that they either fail then, or not. This saves us from having to migrate
customers off of new production servers just a few days after they've gone live.
The testing is of course all automated.
<p class="ad"> <b>Recently I removed all Google Ads from this site due to their invasive tracking, as well as Google Analytics. Please, if you found this content useful, consider a small donation using any of the options below:</b><br><br> <a href="
https://leafnode.nl">I'm developing an open source monitoring app called Leaf Node Monitoring, for windows, linux & android. Go check it out!</a><br><br> <a href="
https://github.com/sponsors/RaymiiOrg/">Consider sponsoring me on Github. It means the world to me if you show your appreciation and you'll help pay the server costs.</a><br><br> <a href="
https://www.digitalocean.com/?refcode=7435ae6b8212">You can also sponsor me by getting a Digital Ocean VPS. With this referral link you'll get $100 credit for 60 days. </a><br><br> </p>
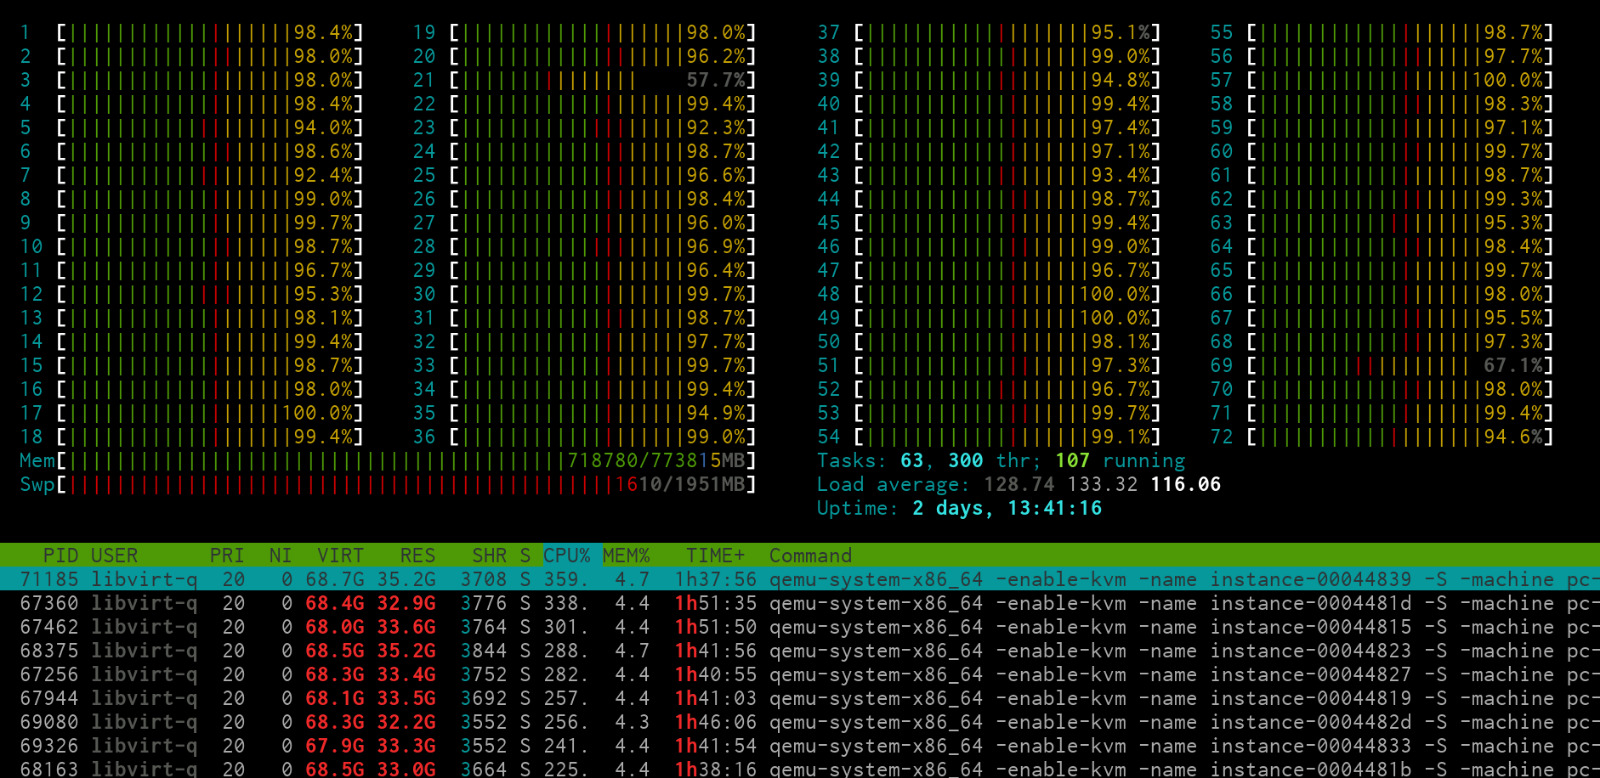
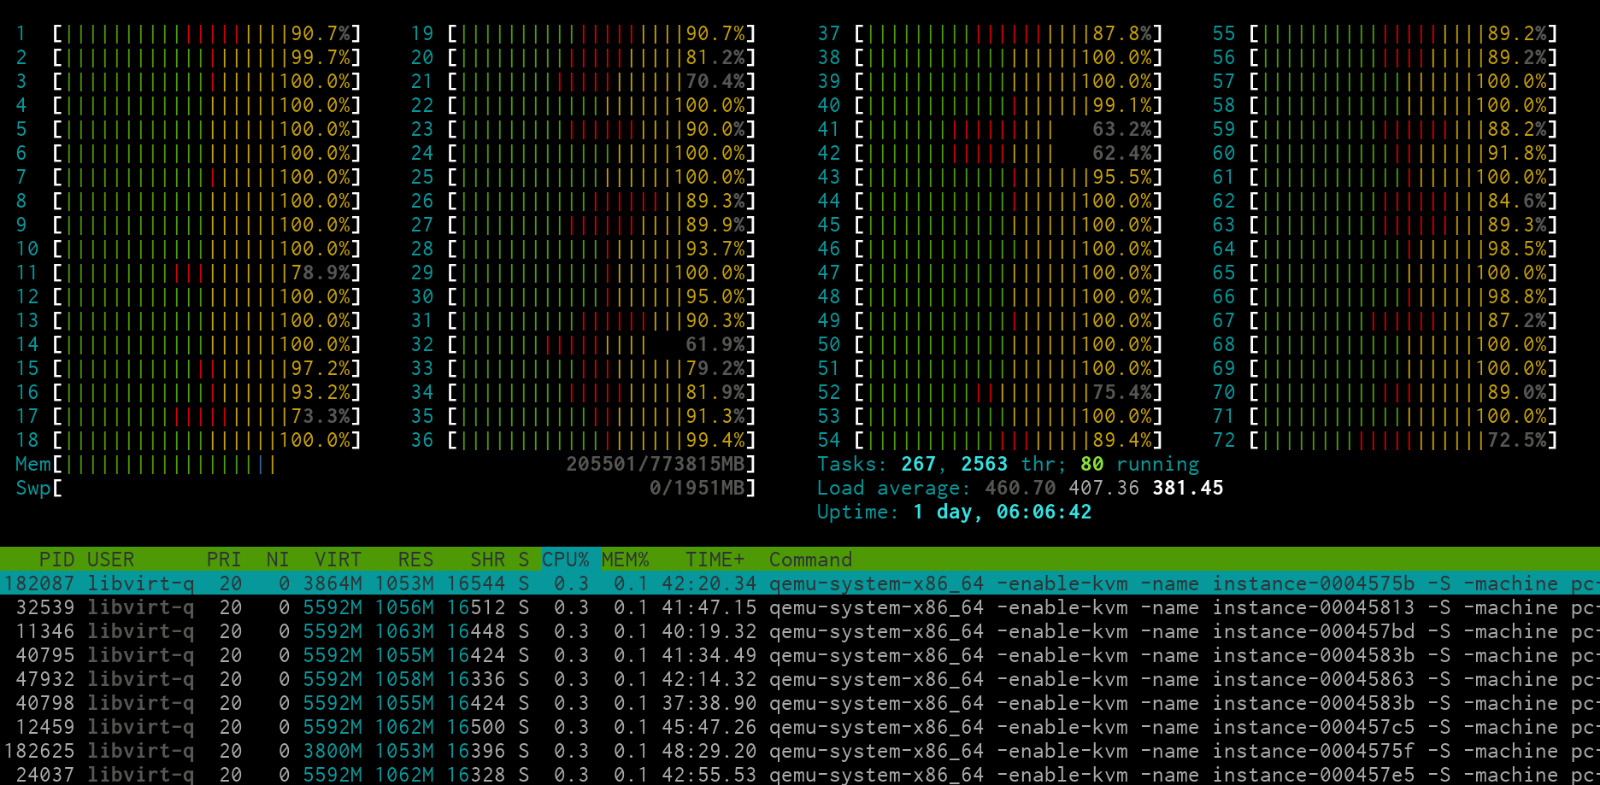
![][2]
> A very busy hypervisor node
### Preface
This article is not a copy and paste tutorial. It's more a walkthrough of the
processes used and the thought process behind it.
As said, I currently work at an OpenStack public cloud provider. That means that
you can order a virtual server with us and get full administrative access to it.
We use OpenStack, so you can also automate that part using the API and deploy
instances automatically. Those virtual machines do need to run on actual
hardware, which is where this article comes in.
![][3]
The regular process for deploying new hardware is fully automated. We've got
capacity management nailed down, once the OpenStack environment reaches a
certain threshold, PDF's are automatically generated with investment requests
and sent off to the finance department and the hardware is ordered. Then after
some time, the nodes are shipped to the datacenters. Our datacenter team handles
the racking and stacking. They setup the remote out of band management (ILO,
iDrac, IPMI) and put the credentials into the PXE deployment servers (MaaS).
The machine get's installed with the required OS automatically and after that
the software stack (OpenStack) is installed. The machine firmwares are then
updated to the latest versions, the rest of the cluster configuration is updated
and it's ready to go. This is all done using Ansible, after the racking and
stacking no human is involved. The only thing I have to do is to enable the
`nova` or `cinder` service in OpenStack for that machine, and it's ready to go.
The machine is automatically put into our monitoring system as well. We not only
monitor the software side of things, like cpu load, disk usage, network
connections, required services running, but also the hardware itself. Either via
the remote out of band management or vendor provided tools (`omreport` anyone?).
Which means that when a disk breaks, or a faulty memory module is found, our
monitoring system alerts us and takes action automatically. When defective disks
are detected, for example, the vendor automatically gets an RMA sent from our
monitoring. Once a week a bunch of disks arrive at the office or the data
center, depending on the vendor, and the datacenter team replace the faulty
ones. Even the list with disks to replace by that team it automatically sent
from the monitoring.
This level of automation is required when you reach a scale like this. By
automating all of this, our sysadmin team can focus on other things than the
gruntwork of installing software or ordering hardware. This level of automation
and monitoring also provides a layer to build stuff on top of, which we will be
doing here.
### The Problem
Stuff breaks. It's technology, so just like your car, things break. That's not a
problem if you've built your environment redundantly and highly available, but
my experience is that not a lot of people do that.
Hardware breakage usually doesn't mean downtime right away. Most parts are
redundant. Multiple network interfaces that are bonded. Hard disks are in a form
of RAID. Multiple PSU's on different power feeds. Multiple CPU's. Same goes for
the network and other hardware. If a NIC fails, the bond will make sure the
system keeps working. A drive dies? One of the spares is automatically put in
the vdev or array and is rebuilt. Power goes out or a PSU blows? The other feed
keeps running. However, it does mean that the faulty part needs to be replaced
and possibly that customers that have instances or storage running on the
hypervisor need to be migrated off there.
Migrating instances and storage is something that we do a lot. Not just when
there are problems with hardware, also for regular maintenance. Servers need
updates to their software and firmware. The updates are done with Ansible and
are automated. We've written software that checks if there is enough cluster
capacity and no issues in the monitoring. If so, it checks if a node had
firmware updates outstanding, or more than 50 packages or a security package
update outstanding, and if so it schedules a node for emptying out.
We use live migrates and that process it automated as well, but it does add
extra workload. Especially larger Windows VM's on KVM tend to lock up and break
during a live-migrate, those need some tender love and care. Migrating storage
(OpenStack Cinder Volumes) goes fine, never had any issues with that.
Depending on the used configuration, OpenStack can use local storage or Ceph.
With Ceph, live migrated of Volumes and Instances is very easy and fast. Local
storage takes longer, since then the disks need to be copied over.
Once the node is empty, it's updated, both software and firmware, with the same
playbooks we use when a new node is installed. When that's done, it's rebooted
and enabled back in OpenStack. This process is done a few times a day, making
sure all the hardware is updated regularly. Due to our environment getting
bigger and bigger, it takes longer to update all nodes, so we are testing if we
can do more than one node at a time.
New hardware, or hardware that has had issues and got replacement parts, tends
to break more often than hardware that we have in use for a few months. Mostly
hard disks or memory modules (ECC RAM), but I've also seen PSU's blow, and once
we had drops of solder breaking off a fibre channel NIC and causing a short. As
said, it's technology, so stuff breaks. All covered by warranty, so not a big
problem.
### Simulating usage patterns
New hardware, or hardware that is put back into production after a repair wasn't
getting a burn in test beforehand. Mostly because the amount of problems we
experienced was small, just a one off most of the time. Now we are a lot larger,
almost every week there is new hardware to be racked, so we see more problems.
Just a scale issue, nothing to worry about. I suspect that when you are a large
car shop you get more faulty returns than when your a local garage around the
corner.
Since we saw that hardware can break when it's being used regularly, we also
must test it using mostly regular usage patterns. For compute nodes that means,
install OpenStack and run VM's. For storage machines, that means, install
OpenStack and the specific storage (ZFS, Ceph, Linux LVM) and generate IO.
Because we do want to stress the node a bit, we generate usage that under normal
conditions would count as abuse. We thought of bitcoin miners or BOINC
(SETI@HOME), but decided that that wouldn't be reproducable enough. Therefore we
went with regular tools, like `stress`, `stress-ng`, `memtest`, `dd` and
`iperf`.
Using OpenStack Userdata we provide a script to the instance that installs the
packages and runs them in a specified order for a set amount of time. In my
example every tool, testing a specific aspect (CPU, RAM, etc) runs for 15
minutes and then continues on to the next part. By creating a VM every 10
minutes, all usage patterns are equal. With that I mean that the CPU isn't
hammered for 15 minutes, then the RAM, then the NIC. No, one instance is
hammering the disk while another is using all it's CPU.
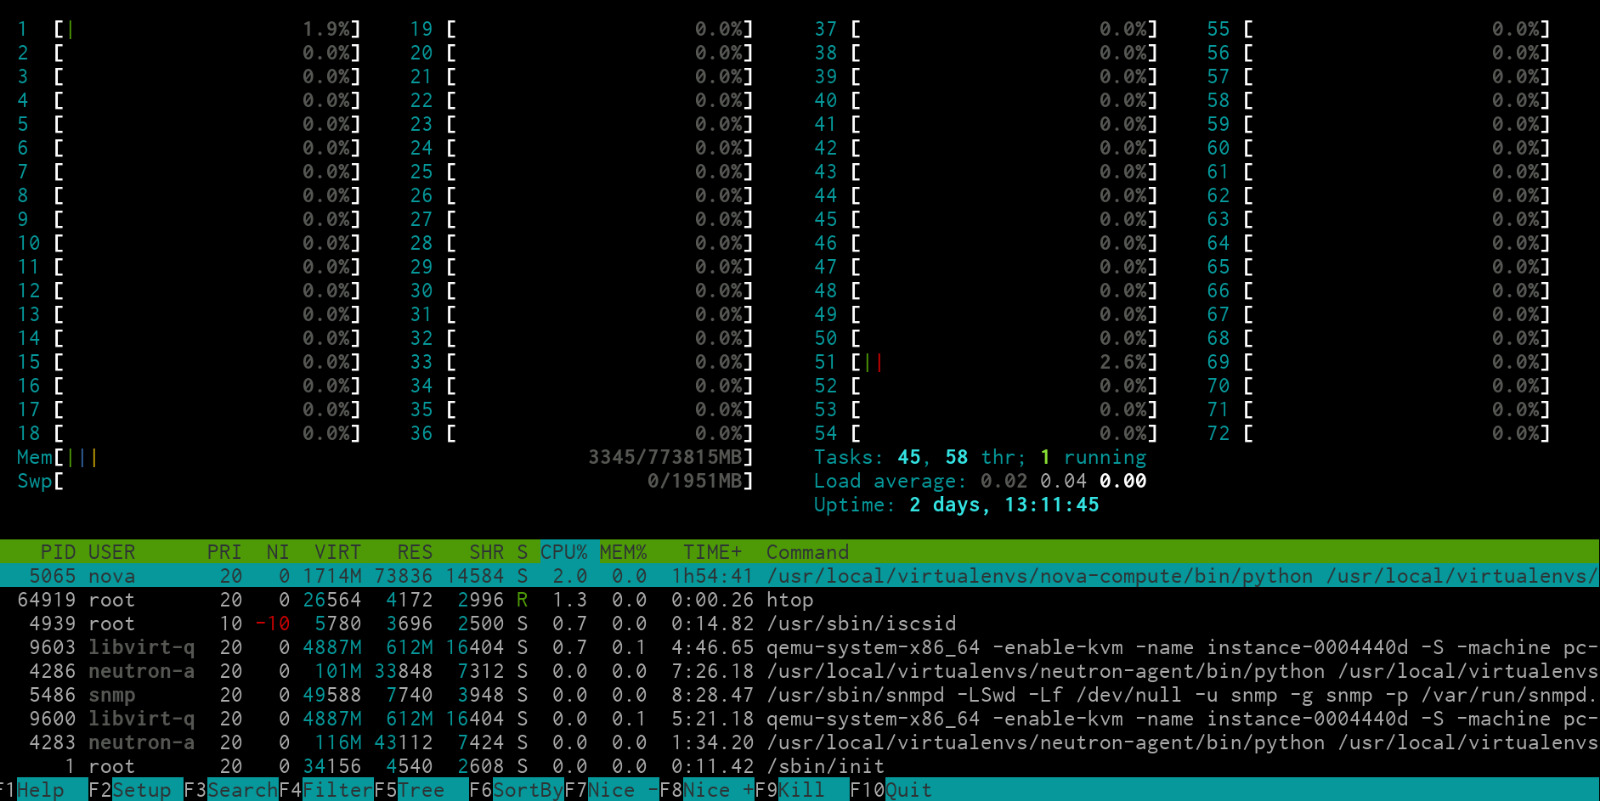
The below image shows `htop` on one of our empty compute nodes:
![][4]
One thing we do not test enough is a huge amount of small VM's, thus having a
lot of hardware interrupts and context switching. My testing uses a few large
instances, which, in our case, tests the stuff we need. These burn in tests have
saved us over two dozen nodes with issues going into production in the first
three months of using this new procedure. In saved-man-hours on RMA and
replacement that's almost three people fulltime for a week. Huge cost-savings.
Let's continue on to the actual testing to see how much this node can be
hammered.
### Compute servers: stress, stress-ng and other tools
For the compute node benchmarking I'm using an Ubuntu 14.04 VM. I'm not able to
share the Ansible playbooks we are using, but I can give you the manual
commands. It's not that hard to put one and one together and create your own
version. Or, if you don't get new hardware so often, just do it manually.
In our specific OpenStack deployments we have an administrative user. We need
this to override the scheduler and control on which compute node the VM's get
spawned. We also have a special flavor with no IOPS or other usage limits.
Regular customer instances have CPU, network and iops limits set and that we
don't want in this case.
By specifing the specific node in the `nova boot` command, we can force a VM to
get spawned on that hypervisor:
nova boot --flavor="nolimit" --image "Ubuntu 14.04" --nic net-id=00000000-0000-0000-0000-000000000000 --availability-zone NL1:compute-x-y
This does allow you to overload the hypervisor with instances. In our case it
either cannot boot them and the logs say, cannot allocate memory. Or, the out-
of-memory killer on the hypervisor just kills the `qemu` process and the
instance is in state stopped. The nova instance action list doesn't show that
action (because it went outside of nova).
#### Out of memory
Inside the instances it's important to disable the linux OOM killer. Otherwise
it will stop your stress tests. You can do this on the hypervisor as well, but
that might have unexpected side effects. Make sure you have out of band access
so that you can reboot a node when it has hung itself up to a tree.
Here's how to disable the OOM killer inside of your VM:
sysctl vm.overcommit_memory=2
If you want it to survive a reboot, place it in `sysctl.conf`:
echo "vm.overcommit_memory=2" >> /etc/sysctl.conf
#### Install packages
The software we're using is all in the Ubuntu repositories. Install the
packages:
apt-get -y install vnstat memtester stress stress-ng iperf
#### CPU
The first part takes the CPU and uses `stress` to generate usage:
stress --cpu $(nproc) --timeout 900
`nproc` gives me the number of cores available, which is usable for the VM.
Stress with the `--cpu` parameter spins up processes in a tight loop calculating
the `sqrt()` of a random number acquired with `rand()`.
#### Memory
For RAM, I found `stress` not getting that much result as its modern counterpart
`stress-ng` did. `stress` doesn't have an option to utilize the RAM, `stress-ng`
does:
stress-ng -vm 60 --vm-bytes 1G -t 900s --vm-method zero-one --metrics-brief
As per the manpage, `-vm` starts N workers continuously calling
mmap(2)/munmap(2) and writing to the allocated memory. `--vm-method zero-one`
sets all memory bits to zero and then checks if any bits are not zero. Next, set
all the memory bits to one and check if any bits are not one. Simple but
effective test. My instance has 64 GB RAM so 60 workers using 1 GB each will
fill the RAM up nicely.
This memory abuse has triggered a lot of servers where one of the RAM DIMM's was
bad. Even though we always have ECC RAM. Only after a few hours of running, not
right away.
#### Disk
In our setup Ceph is mostly used, but we do also have local disks or volume
servers (boot from volume) with ZFS. When a compute node has local disks we test
them, otherwise it isn't much use since the storage servers are stressed
differently.
`stress` has two different use cases for disk IO. The first does actual writes.
stress --hdd $(nproc) --hdd-bytes 100G --timeout 900
`--hdd` spawns N workers spinning on `write()`/`unlink()`. `--hdd-bytes` write B
bytes per hdd worker (default is 1GB).
stress --io $(nproc) --timeout 900
`--io` spawns N workers spinning on `sync()`.
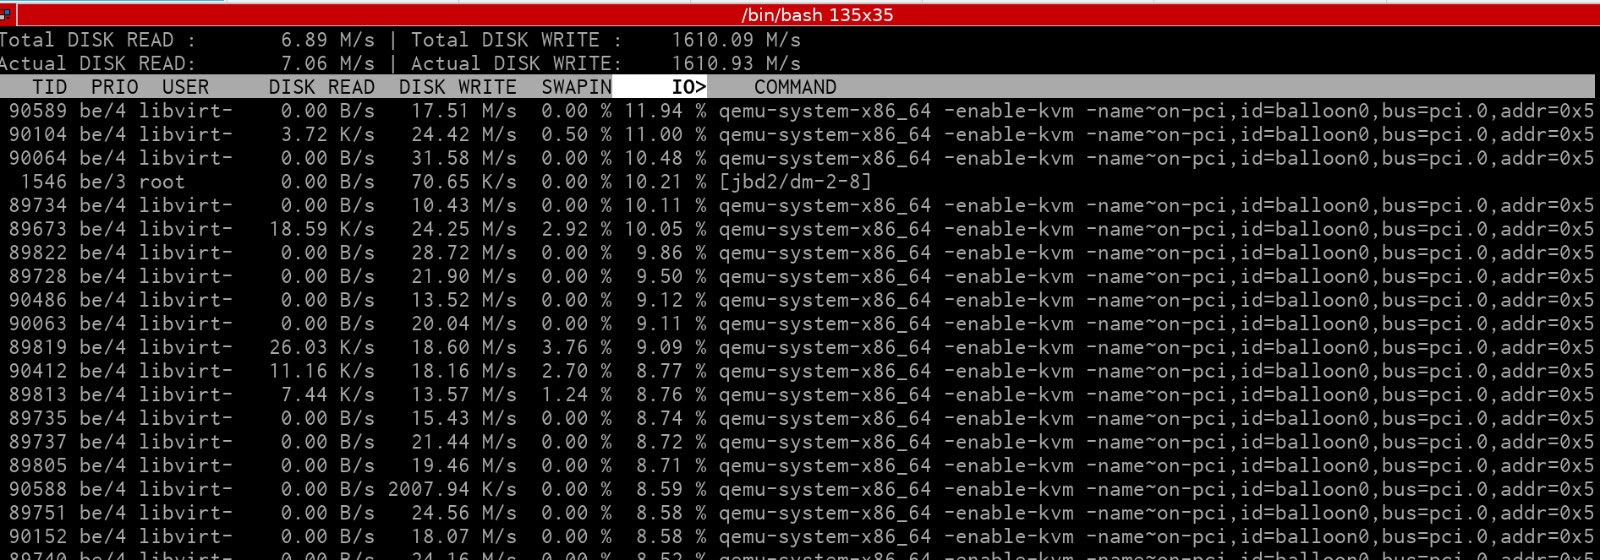
Below is a screenshot of `iotop` on the compute node when a burn-in test is
running on disk io with these tests:
![][5]
There have been four SSD's so far that needed replacing when these tests ran for
a day. On average that suprised me, since I suspected it to be a lot more.
#### Network
For the sake of testing we also do a speedtest to an internal `iperf` server. I
haven't seen any network cards fail yet. It is however nice that we can utilize
the network card to it's fullest potential. I did find one card that had been
configured in 10 mbit half-duplex mode because of a bad cable while running this
test. However I was looking at it then, that's not something the monitoring
tools report on (yet):
iperf --port 5002 --client speedtest.serverius.net --dualtest --time 900 --format M
I replaced our `iperf` server address with a public `iperf` server address.
### Storage servers: dd, dd and some more dd
Our storage servers are tested by doing a lot of disk activity. Since we do want
to simulate actual usage, we install them as OpenStack Cinder servers and create
volumes on them. Those volumes are then attached to an instance. On the
instance, using `zfs`, we create a big pool (named `tank`) (no `raidZ` or
mirroring) and one dataset (named `bullet`). Then, using `dd`, we first write
zero's for a few hours. Afterwards, also using `dd` and random data from
`openssl` (`/dev/urandom` is too slow), actual data is written.
This could of course also be done with regular LVM volumes or `mdraid`. The
tests however are adapted from work I already had laying around, that playbook
already did `zfs`, so not much use in re-inventing the wheel.
I'm using Ubuntu 16.04 because of the ZFS support in there. First install it:
apt-get install zfsutils-linux zfs
Using `parted` with `ansible`, create a `gpt` partition:
- name: partition gpt
parted:
device: "{{ item }}"
label: gpt
state: present
with_items:
- /dev/sdb
- /dev/sdc
- /dev/sdd
- /dev/...
Create the `zpool` and the `dataset` (again, with Ansible):
- name: Create the zpool
shell: |
zpool create tank /dev/sdb /dev/sdc /dev/sdd /dev/... && \
zfs set compression=lz4 tank && \
zfs set atime=off tank
- name: Create fs
zfs:
name: tank/bullet
state: present
It will be automatically mounted and available under `/tank/bullet`.
The first `dd` command:
dd if=/dev/zero of=/tank/bullet/bench bs=20000M count=1024 conv=fdatasync,notrunc
In my case the pool is 20 TB. Change where needed. Writing zero's will go full
speed. If you want to test actual data writing, and thus bypass any cache or
raid controllers, you need to generate random data. `/dev/random` and
`/dev/urandom` are way to slow. I've found the following command to get
acceptable speeds:
openssl enc -aes-256-ctr -pass pass:"$(dd if=/dev/urandom bs=128 count=1 2>/dev/null | base64)" -nosalt < /dev/zero > /tank/bullet/bench
This will use the `AES-NI` CPU instruction if your VM supports it. Let this run
for a few hours and you will have all your disks written to. Do note that a full
`zfs` will be extremely slow and behave weirdly. Throw away the VM and boot up a
new one, rinse and repeat.
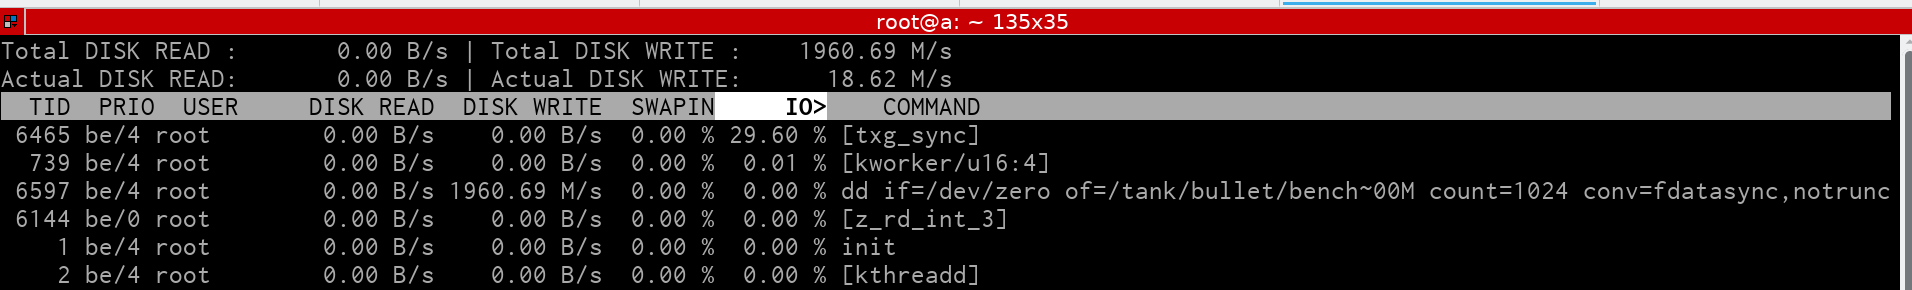
### The result
![][6]
> Writing zero's at near-line speed
![][2]
> A busy hypervisor node
![][7]
> An even more busy hypervisor node
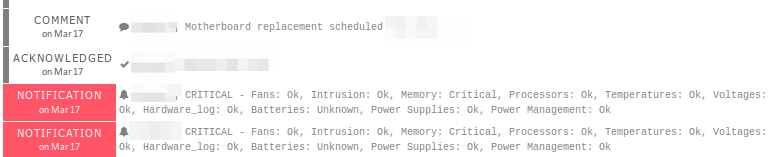
You might get crashing servers or overheated switches. At one of my previous
employers we actually found out that the fan rig wasn't correctly wired due to
CPU heat alarms going off in the `ipmi`. Once again, make sure you have good
monitoring and out of band access. This will happen often:
![][8]
Which is of course a good thing when the hardware is not yet in use.
[1]:
https://www.digitalocean.com/?refcode=7435ae6b8212
[2]:
https://raymii.org/s/inc/img/busy-compute.jpg
[3]:
https://raymii.org/s/inc/img/automate-all-the-things.png
[4]:
https://raymii.org/s/inc/img/empty-compute.jpg
[5]:
https://raymii.org/s/inc/img/iops-compute.jpg
[6]:
https://raymii.org/s/inc/img/iops-zfs.png
[7]:
https://raymii.org/s/inc/img/busy-compute2.jpg
[8]:
https://raymii.org/s/inc/img/notification-memory.png
---
License:
All the text on this website is free as in freedom unless stated otherwise.
This means you can use it in any way you want, you can copy it, change it
the way you like and republish it, as long as you release the (modified)
content under the same license to give others the same freedoms you've got
and place my name and a link to this site with the article as source.
This site uses Google Analytics for statistics and Google Adwords for
advertisements. You are tracked and Google knows everything about you.
Use an adblocker like ublock-origin if you don't want it.
All the code on this website is licensed under the GNU GPL v3 license
unless already licensed under a license which does not allows this form
of licensing or if another license is stated on that page / in that software:
This program is free software: you can redistribute it and/or modify
it under the terms of the GNU General Public License as published by
the Free Software Foundation, either version 3 of the License, or
(at your option) any later version.
This program is distributed in the hope that it will be useful,
but WITHOUT ANY WARRANTY; without even the implied warranty of
MERCHANTABILITY or FITNESS FOR A PARTICULAR PURPOSE. See the
GNU General Public License for more details.
You should have received a copy of the GNU General Public License
along with this program. If not, see <
http://www.gnu.org/licenses/>.
Just to be clear, the information on this website is for meant for educational
purposes and you use it at your own risk. I do not take responsibility if you
screw something up. Use common sense, do not 'rm -rf /' as root for example.
If you have any questions then do not hesitate to contact me.
See
https://raymii.org/s/static/About.html for details.