This is a text-only version of the following page on
https://raymii.org:
---
Title : Bind DNS Query Graph Charts with GNUPlot
Author : Remy van Elst
Date : 13-08-2013
URL :
https://raymii.org/s/software/Bind-GNUPlot-DNS-Bar-Graph.html
Format : Markdown/HTML
---
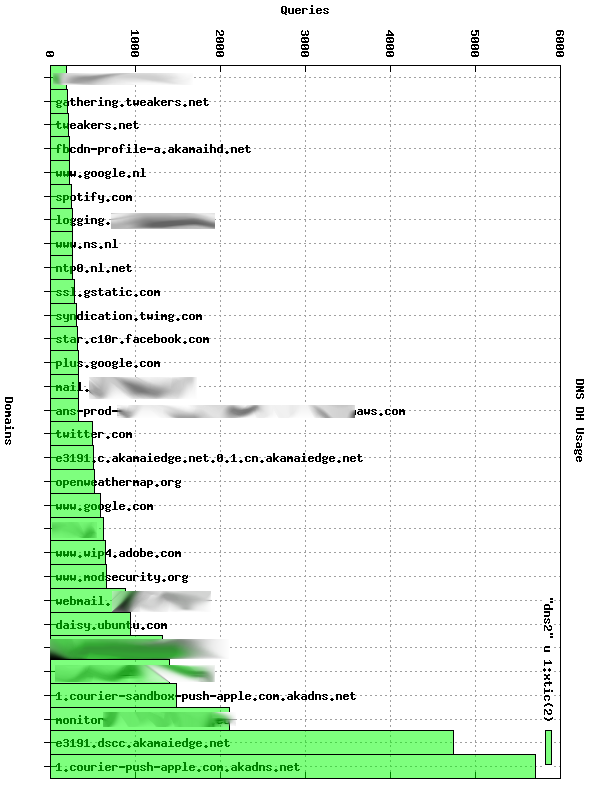
![bind][1]
This is a very simple script which uses GNUplot to create graphs of Bind Query
logs.
<p class="ad"> <b>Recently I removed all Google Ads from this site due to their invasive tracking, as well as Google Analytics. Please, if you found this content useful, consider a small donation using any of the options below:</b><br><br> <a href="
https://leafnode.nl">I'm developing an open source monitoring app called Leaf Node Monitoring, for windows, linux & android. Go check it out!</a><br><br> <a href="
https://github.com/sponsors/RaymiiOrg/">Consider sponsoring me on Github. It means the world to me if you show your appreciation and you'll help pay the server costs.</a><br><br> <a href="
https://www.digitalocean.com/?refcode=7435ae6b8212">You can also sponsor me by getting a Digital Ocean VPS. With this referral link you'll get $100 credit for 60 days. </a><br><br> </p>
### Bind logging
Enable query logging in Bind:
# /etc/bind/named.conf.options
logging{
channel system_log {
file "/var/log/named/sys.log" versions unlimited size 2g;
severity warning;
print-time yes;
print-severity yes;
print-category yes;
};
channel queries_log {
file "/var/log/named/queries.log" versions unlimited size 2g;
severity info;
print-time no;
};
category default{
system_log;
};
category queries{
queries_log;
};
};
Don't forget to create the `/var/log/named` folder:
mkdir /var/log/named
chown bind:bind /var/log/named
Why `/var/log/named`? Because AppArmor on Ubuntu allows bind to write to this
path, and I don't like messing with either AppArmor or SELinux.
### Bind log parsing
Use the following command line to get the 20 most queries domains
awk '{ print $4 }' /var/log/named/queries.log | sort | uniq -c | sort -n | tail -n 20 > dns-data
Example data:
83094 metrics-api.librato.com
83689 collector-2.newrelic.com
84165 puppetmaster.int
82445 ntp0.nl.net
The use the gnuplot script to create the graph:
gnuplot < plot.gplt
And there you go. This is the GNUPlot script if you don't want to check out the
repo.
set term png truecolor size 800,600
set output "data.png"
set xlabel "Domains"
set ylabel "Queries"
set title "DNS Usage"
set grid
set xtics rotate by -45 axis out offset 0,1.5
set boxwidth 1 relative
set style fill transparent solid 0.5 border rgb"black"
plot "dns-data" u 1:xtic(2) w boxes lc rgb"blue"
Because GNUplot has no easy support for horizotal bar graphs, if you want it
horizontal, rotate it with Imagemagick:
convert data.png -rotate 90 data-90.png
You now have a nice image overview of DNS queries.
### Links
* [Raymii.org][3]
* [Github][4]
### License
Copyright (C) 2013 Remy van Elst
This program is free software: you can redistribute it and/or modify
it under the terms of the GNU General Public License as published by
the Free Software Foundation, either version 3 of the License, or
(at your option) any later version.
This program is distributed in the hope that it will be useful,
but WITHOUT ANY WARRANTY; without even the implied warranty of
MERCHANTABILITY or FITNESS FOR A PARTICULAR PURPOSE. See the
GNU General Public License for more details.
You should have received a copy of the GNU General Public License
along with this program. If not, see <
http://www.gnu.org/licenses/>.
[1]:
https://raymii.org/s/inc/img/dns-report.png
[2]:
https://www.digitalocean.com/?refcode=7435ae6b8212
[3]:
https://raymii.org/s/software/Bind-GNUPlot-DNS-Bar-Graph.html
[4]:
https://github.com/RaymiiOrg/bind-gnuplot-reports
---
License:
All the text on this website is free as in freedom unless stated otherwise.
This means you can use it in any way you want, you can copy it, change it
the way you like and republish it, as long as you release the (modified)
content under the same license to give others the same freedoms you've got
and place my name and a link to this site with the article as source.
This site uses Google Analytics for statistics and Google Adwords for
advertisements. You are tracked and Google knows everything about you.
Use an adblocker like ublock-origin if you don't want it.
All the code on this website is licensed under the GNU GPL v3 license
unless already licensed under a license which does not allows this form
of licensing or if another license is stated on that page / in that software:
This program is free software: you can redistribute it and/or modify
it under the terms of the GNU General Public License as published by
the Free Software Foundation, either version 3 of the License, or
(at your option) any later version.
This program is distributed in the hope that it will be useful,
but WITHOUT ANY WARRANTY; without even the implied warranty of
MERCHANTABILITY or FITNESS FOR A PARTICULAR PURPOSE. See the
GNU General Public License for more details.
You should have received a copy of the GNU General Public License
along with this program. If not, see <
http://www.gnu.org/licenses/>.
Just to be clear, the information on this website is for meant for educational
purposes and you use it at your own risk. I do not take responsibility if you
screw something up. Use common sense, do not 'rm -rf /' as root for example.
If you have any questions then do not hesitate to contact me.
See
https://raymii.org/s/static/About.html for details.